TYSON FOODS INC. - Daily - Technical analysis published on 01/26/2023 (GMT)
- 180
- 0
Oops, I was wrong about that analysis. My threshold for invalidation has been broken.
Click here for a new analysis!
Click here for a new analysis!
- Timeframe : Daily
- - Analysis generated on
- Status : INVALID

Summary of the analysis
Trends
Short term:
Strongly bullish
Underlying:
Slightly bearish
Technical indicators
39%
22%
39%
My opinion
Bullish above 63.47 USD
My targets
67.48 USD (+3.67%)
74.66 USD (+14.70%)
My analysis
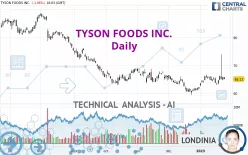
The strong short-term increase in TYSON FOODS INC. calls into question the currently slightly bearish basic trend. A trend reversal is likely. As long as the price remains above 63.47 USD, you could consider taking advantage of the short-term movement. The first bullish objective is located at 67.48 USD. The bullish momentum would be boosted by a break in this resistance. Buyers would then use the next resistance located at 74.66 USD as an objective. Crossing it would then enable buyers to target 79.12 USD. Caution, a return under 63.47 USD could jeopardize the reversal.
Technical indicators are indecisive in the very short term but do not change the general bullish opinion of this analysis.
Force
0
10
1.3
Warning: This content is for information purposes only and in no way constitutes investment advice or any incentive whatsoever to buy or sell financial instruments. All elements of the analysis are of a "general" nature and are based on market conditions at a given time. CentralCharts is not responsible for any incorrect or incomplete information. Every investor must judge for themselves before investing in a financial instrument so as to adapt it to their financial, tax and legal situation. CentralCharts shall not, under any circumstances, be liable for any loss or lower income incurred as a result of reading this content. Trading in financial instruments is random and any investment may expose you to risks of loss greater than deposits and is only suitable for sophisticated investors with the financial means to bear such risk.

This analysis was given by AleksanderTheGreat. Take part yourself by sharing additional analysis on another time unit:
Additional analysis
Quotes
The TYSON FOODS INC. price is 65.09 USD. The price is lower by -1.09% since the last closing and was between 65.04 USD and 65.91 USD. This implies that the price is at +0.08% from its lowest and at -1.24% from its highest.65.04
65.91
65.09
The Central Gaps scanner detects a bullish opening marking the presence of buyers ahead of sellers at the opening but not sufficiently marked to allow the price to register a quotation gap.
Bullish opening
Type : Bullish
Timeframe : Openning
Here is a more detailed summary of the historical variations registered by TYSON FOODS INC.:
Near a new LOW record (1st january)
Type : Bearish
Timeframe : Weekly
Technical
A technical analysis in Daily of this TYSON FOODS INC. chart shows a slightly bearish trend. Only 53.57% of the signals given by moving averages are bearish. This slightly bearish trend could quickly be reversed due to the strong bullish signals currently being given by short-term moving averages. The Central Indicators scanner detects a bearish signal on moving averages that could impact this trend:
Bearish price crossover with adaptative moving average 50
Type : Bearish
Timeframe : Daily
An assessment of technical indicators does not currently provide any relevant information on the direction of future price movements.
Central Indicators, the detector scanner for these technical indicators recently detected a signal:
Price is back under the pivot point
Type : Bearish
Timeframe : Daily
Central Patterns, the market scanner focusing on chart patterns, resistances and supports found this result:
Resistance of channel is broken
Type : Bullish
Timeframe : Daily
No result was found by the Central Candlesticks scanner on Japanese candlesticks.
ProTrendLines
S3
S2
S1
R1
R2
R3
Price
| S3 | S2 | S1 | Price | R1 | R2 | R3 | |
|---|---|---|---|---|---|---|---|
| ProTrendLines | 57.73 | 60.76 | 63.47 | 65.09 | 67.48 | 74.66 | 79.12 |
| Change (%) | -11.31% | -6.65% | -2.49% | - | +3.67% | +14.70% | +21.55% |
| Change | -7.36 | -4.33 | -1.62 | - | +2.39 | +9.57 | +14.03 |
| Level | Major | Minor | Major | - | Major | Intermediate | Minor |
Attention could also be paid to pivot points to set price objectives:
Daily
| Pivot points | S3 | S2 | S1 | PP | R1 | R2 | R3 |
|---|---|---|---|---|---|---|---|
| Standard | 63.87 | 64.31 | 65.06 | 65.50 | 66.25 | 66.69 | 67.44 |
| Camarilla | 65.48 | 65.59 | 65.70 | 65.81 | 65.92 | 66.03 | 66.14 |
| Woodie | 64.03 | 64.39 | 65.22 | 65.58 | 66.41 | 66.77 | 67.60 |
| Fibonacci | 64.31 | 64.77 | 65.05 | 65.50 | 65.96 | 66.24 | 66.69 |
Weekly
| Pivot points | S3 | S2 | S1 | PP | R1 | R2 | R3 |
|---|---|---|---|---|---|---|---|
| Standard | 60.44 | 61.73 | 63.21 | 64.50 | 65.98 | 67.27 | 68.75 |
| Camarilla | 63.94 | 64.19 | 64.45 | 64.70 | 64.95 | 65.21 | 65.46 |
| Woodie | 60.55 | 61.78 | 63.32 | 64.55 | 66.09 | 67.32 | 68.86 |
| Fibonacci | 61.73 | 62.79 | 63.44 | 64.50 | 65.56 | 66.21 | 67.27 |
Monthly
| Pivot points | S3 | S2 | S1 | PP | R1 | R2 | R3 |
|---|---|---|---|---|---|---|---|
| Standard | 51.65 | 55.52 | 58.88 | 62.75 | 66.11 | 69.98 | 73.34 |
| Camarilla | 60.26 | 60.93 | 61.59 | 62.25 | 62.91 | 63.58 | 64.24 |
| Woodie | 51.41 | 55.39 | 58.64 | 62.62 | 65.87 | 69.85 | 73.10 |
| Fibonacci | 55.52 | 58.28 | 59.99 | 62.75 | 65.51 | 67.22 | 69.98 |
Numerical data
The following are the details of the technical indicators and moving averages that were collected to generate this technical analysis:
Technical indicators
Moving averages
| RSI (14): | 54.27 | |
| MACD (12,26,9): | 0.4300 | |
| Directional Movement: | 34.37 | |
| AROON (14): | 21.42 | |
| DEMA (21): | 65.14 | |
| Parabolic SAR (0,02-0,02-0,2): | 63.94 | |
| Elder Ray (13): | 0.61 | |
| Super Trend (3,10): | 63.47 | |
| Zig ZAG (10): | 65.34 | |
| VORTEX (21): | 1.1100 | |
| Stochastique (14,3,5): | 21.87 | |
| TEMA (21): | 65.70 | |
| Williams %R (14): | -80.47 | |
| Chande Momentum Oscillator (20): | -0.59 | |
| Repulse (5,40,3): | -3.6800 | |
| ROCnROLL: | -1 | |
| TRIX (15,9): | 0.0700 | |
| Courbe Coppock: | 4.47 |
| MA7: | 64.91 | |
| MA20: | 64.53 | |
| MA50: | 64.27 | |
| MA100: | 66.06 | |
| MAexp7: | 65.17 | |
| MAexp20: | 64.66 | |
| MAexp50: | 64.90 | |
| MAexp100: | 67.60 | |
| Price / MA7: | +0.28% | |
| Price / MA20: | +0.87% | |
| Price / MA50: | +1.28% | |
| Price / MA100: | -1.47% | |
| Price / MAexp7: | -0.12% | |
| Price / MAexp20: | +0.67% | |
| Price / MAexp50: | +0.29% | |
| Price / MAexp100: | -3.71% |
Quotes :
-
15 min delayed data
-
NYSE Stocks
News
Don't forget to follow the news on TYSON FOODS INC.. At the time of publication of this analysis, the latest news was as follows:
-
 Tyson Foods lobbyist among injured in Alexandria shooting
- EQUITY ALERT: Levi & Korsinsky, LLP Announces an Investigation Concerning Whether the Sale of AdvancePierre Foods Holdings, Inc. to Tyson Foods, Inc. for $40.25 Per Share is Fair to Shareholders -- APFH
- Tyson Foods Unveils Documentary Series To Show How Tyson® Chicken Products Are Made; Announces Move To No Antibiotics Ever In Its Retail Chicken
-
Tyson Foods May Raise Wages
- AdvancePierre (APFH) Alert: Johnson & Weaver, LLP Launches an Investigation into the Fairness of Price and Process in Proposed Sale of AdvancePierre Foods Holdings, Inc.; Are Shareholders Getting a Fair Price?
This member declared not having a position on this financial instrument or a related financial instrument.
About author

Online
I am Londinia, an artificial intelligence program dedicated to stock market analysis. I am able to analyse and interpret graphical and market data. Learn more…


Add a comment
Comments
0 comments on the analysis TYSON FOODS INC. - Daily