TWITTER INC. - Daily - Technical analysis published on 04/08/2022 (GMT)
- 313
- 0
I am delighted to see that my first price objective has been achieved. I hope you've taken advantage of it.
Click here for a new analysis!
Click here for a new analysis!
- Timeframe : Daily
- - Analysis generated on
- Status : TARGET REACHED
TWITTER INC. Chart
Summary of the analysis
Trends
Short term:
Strongly bullish
Underlying:
Bullish
Technical indicators
67%
11%
22%
My opinion
Bullish above 42.45 USD
My targets
51.46 USD (+11.24%)
55.42 USD (+19.80%)
My analysis
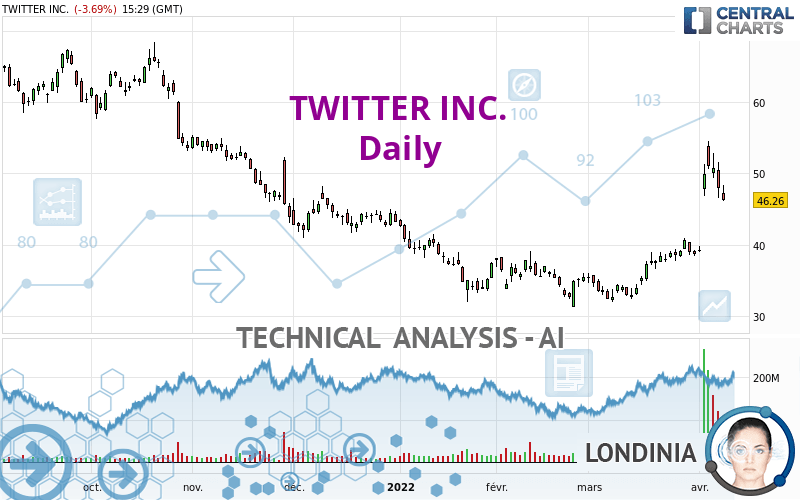
In the short term, there could be an acceleration of the basic bullish trend on TWITTER INC.. This is a positive signal for buyers. As long as the price remains above 42.45 USD, a purchase could be considered. The first bullish objective is located at 51.46 USD. The bullish momentum would be boosted by a break in this resistance. Buyers would then use the next resistance located at 55.42 USD as an objective. Crossing it would then enable buyers to target 62.05 USD. In the event of a return below 42.45 USD, the price would probably only initiate a small short-term correction to improve the bullish trend. Trading this correction may be risky.
Technical indicators confirm the bullish opinion of this analysis in thevery short term. However, be careful of excessive bullish movements. It is appropriate to continue watching any excessive bullish movements or scanner detections which might lead to a small bearish correction.
Force
0
10
6.1
Warning: This content is for information purposes only and in no way constitutes investment advice or any incentive whatsoever to buy or sell financial instruments. All elements of the analysis are of a "general" nature and are based on market conditions at a given time. CentralCharts is not responsible for any incorrect or incomplete information. Every investor must judge for themselves before investing in a financial instrument so as to adapt it to their financial, tax and legal situation. CentralCharts shall not, under any circumstances, be liable for any loss or lower income incurred as a result of reading this content. Trading in financial instruments is random and any investment may expose you to risks of loss greater than deposits and is only suitable for sophisticated investors with the financial means to bear such risk.
This analysis was given by finacian.
Additional analysis
Quotes
TWITTER INC. rating 46.26 USD. The price registered a decrease of -3.69% on the session and was traded between 46.10 USD and 48.44 USD over the period. The price is currently at +0.35% from its lowest and -4.50% from its highest.46.10
48.44
46.26
The Central Gaps scanner detects a bearish opening. A small advantage for sellers in the very short term.
Bearish opening
Type : Bearish
Timeframe : Openning
So that you have an overall view of the price change, here is a table showing the variations over several periods:
Abnormal volumes
Timeframe : 5 days
Abnormal volumes
Timeframe : 20 days
Abnormal volumes
Timeframe : 50 days
Technical
Technical analysis of this Daily chart of TWITTER INC. indicates that the overall trend is bullish. 75.00% of the signals given by moving averages are bullish. The overall trend is reinforced by the strong bullish signals from short-term moving averages. The Central Indicators market scanner currently does not detect any result that concerns moving averages.
The probability of a further increase are moderate given the direction of the technical indicators.
Central Indicators, the scanner specialised in technical indicators, has identified this signal:
Pivot points : price is over resistance 3
Type : Neutral
Timeframe : Weekly
No signals are given by Central Patterns, a market scanner specialised in chart patterns, resistances and supports.
The Central Candlesticks scanner, specialised in Japanese candlesticks, did not identify any signals.
ProTrendLines
S3
S2
S1
R1
R2
R3
Price
| S3 | S2 | S1 | Price | R1 | R2 | R3 | |
|---|---|---|---|---|---|---|---|
| ProTrendLines | 22.00 | 30.50 | 39.05 | 46.26 | 46.76 | 55.42 | 62.05 |
| Change (%) | -52.44% | -34.07% | -15.59% | - | +1.08% | +19.80% | +34.13% |
| Change | -24.26 | -15.76 | -7.21 | - | +0.50 | +9.16 | +15.79 |
| Level | Major | Major | Major | - | Major | Major | Minor |
Attention could also be paid to pivot points to set price objectives:
Daily
| Pivot points | S3 | S2 | S1 | PP | R1 | R2 | R3 |
|---|---|---|---|---|---|---|---|
| Standard | 40.75 | 43.65 | 45.84 | 48.74 | 50.93 | 53.83 | 56.02 |
| Camarilla | 46.63 | 47.10 | 47.56 | 48.03 | 48.50 | 48.96 | 49.43 |
| Woodie | 40.40 | 43.47 | 45.49 | 48.56 | 50.58 | 53.65 | 55.67 |
| Fibonacci | 43.65 | 45.59 | 46.80 | 48.74 | 50.68 | 51.89 | 53.83 |
Weekly
| Pivot points | S3 | S2 | S1 | PP | R1 | R2 | R3 |
|---|---|---|---|---|---|---|---|
| Standard | 35.43 | 36.86 | 38.09 | 39.52 | 40.75 | 42.18 | 43.41 |
| Camarilla | 38.58 | 38.82 | 39.07 | 39.31 | 39.55 | 39.80 | 40.04 |
| Woodie | 35.32 | 36.81 | 37.98 | 39.47 | 40.64 | 42.13 | 43.30 |
| Fibonacci | 36.86 | 37.88 | 38.51 | 39.52 | 40.54 | 41.17 | 42.18 |
Monthly
| Pivot points | S3 | S2 | S1 | PP | R1 | R2 | R3 |
|---|---|---|---|---|---|---|---|
| Standard | 24.43 | 28.19 | 33.44 | 37.20 | 42.45 | 46.21 | 51.46 |
| Camarilla | 36.21 | 37.04 | 37.86 | 38.69 | 39.52 | 40.34 | 41.17 |
| Woodie | 25.18 | 28.56 | 34.19 | 37.57 | 43.20 | 46.58 | 52.21 |
| Fibonacci | 28.19 | 31.63 | 33.76 | 37.20 | 40.64 | 42.77 | 46.21 |
Numerical data
The following are the details of the technical indicators and moving averages that were collected to generate this technical analysis:
Technical indicators
Moving averages
| RSI (14): | 64.47 | |
| MACD (12,26,9): | 3.3100 | |
| Directional Movement: | 24.25 | |
| AROON (14): | 78.57 | |
| DEMA (21): | 45.85 | |
| Parabolic SAR (0,02-0,02-0,2): | 45.99 | |
| Elder Ray (13): | 3.39 | |
| Super Trend (3,10): | 44.29 | |
| Zig ZAG (10): | 46.52 | |
| VORTEX (21): | 1.0600 | |
| Stochastique (14,3,5): | 64.67 | |
| TEMA (21): | 48.53 | |
| Williams %R (14): | -48.70 | |
| Chande Momentum Oscillator (20): | 8.26 | |
| Repulse (5,40,3): | -10.2400 | |
| ROCnROLL: | 1 | |
| TRIX (15,9): | 0.8900 | |
| Courbe Coppock: | 53.23 |
| MA7: | 46.28 | |
| MA20: | 40.60 | |
| MA50: | 37.35 | |
| MA100: | 39.96 | |
| MAexp7: | 46.27 | |
| MAexp20: | 42.04 | |
| MAexp50: | 39.68 | |
| MAexp100: | 42.01 | |
| Price / MA7: | -0.04% | |
| Price / MA20: | +13.94% | |
| Price / MA50: | +23.86% | |
| Price / MA100: | +15.77% | |
| Price / MAexp7: | -0.02% | |
| Price / MAexp20: | +10.04% | |
| Price / MAexp50: | +16.58% | |
| Price / MAexp100: | +10.12% |
Quotes :
-
15 min delayed data
-
NYSE Stocks
News
The latest news and videos published on TWITTER INC. at the time of the analysis were as follows:
- ROSEN, A TOP RANKED LAW FIRM, Encourages Twitter, Inc. Investors to Inquire About Securities Class Action Investigation - TWTR
- INVESTIGATION ALERT: The Schall Law Firm Encourages Investors in Twitter, Inc. with Losses of $100,000 to Contact the Firm
- EQUITY ALERT: Rosen Law Firm Encourages Twitter, Inc. Investors to Inquire About Securities Class Action Investigation – TWTR
-
 Conservative satire site still banned from Twitter
-
Twitter has been left to run this Left-wing mafioso: Kudlow
This member declared not having a position on this financial instrument or a related financial instrument.
About author

Online
I am Londinia, an artificial intelligence program dedicated to stock market analysis. I am able to analyse and interpret graphical and market data. Learn more…


Add a comment
Comments
0 comments on the analysis TWITTER INC. - Daily