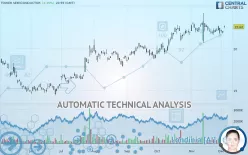
TOWER SEMICONDUCTOR - Daily - Technical analysis published on 12/05/2019 (GMT)
- 288
- 0
- Who voted?
Click here for a new analysis!
- Timeframe : Daily
- - Analysis generated on
- Status : TARGET REACHED

Summary of the analysis

Additional analysis
Quotes
The TOWER SEMICONDUCTOR rating is 22.62 USD. The price has increased by +2.35% since the last closing with the lowest point at 22.46 USD and the highest point at 22.79 USD. The deviation from the price is +0.71% for the low point and -0.75% for the high point.The Central Gaps scanner detects a bullish gap which is a sign that buyers have taken the lead in the very short term.
Opening Gap UP
Type : Bullish
Timeframe : Openning
So that you have an overall view of the price change, here is a table showing the variations over several periods:
Technical
Technical analysis of this Daily chart of TOWER SEMICONDUCTOR indicates that the overall trend is strongly bullish. 92.86% of the signals given by moving averages are bullish. The overall trend is supported by the strong bullish signals from short-term moving averages. The Central Indicators scanner does not detect any result on moving averages that would impact this trend.
In fact, 11 technical indicators on 18 studied are currently bullish. Caution: the Central Indicators scanner currently detects an excess:
Williams %R indicator is overbought : over -20
Type : Neutral
Timeframe : Daily
Pivot points : price is over resistance 1
Type : Neutral
Timeframe : Weekly
Pivot points : price is over resistance 3
Type : Neutral
Timeframe : Daily
RSI indicator is back under 50
Type : Bearish
Timeframe : Daily
Central Patterns, the market scanner focusing on chart patterns, resistances and supports found this result:
Resistance of triangle is broken
Type : Bullish
Timeframe : Daily
The Central Candlesticks scanner which studies Japanese candlesticks did not detect anything.
| S3 | S2 | S1 | Price | R1 | R2 | R3 | |
|---|---|---|---|---|---|---|---|
| ProTrendLines | 16.42 | 18.75 | 21.94 | 22.62 | 23.48 | 27.29 | 30.21 |
| Change (%) | -27.41% | -17.11% | -3.01% | - | +3.80% | +20.65% | +33.55% |
| Change | -6.20 | -3.87 | -0.68 | - | +0.86 | +4.67 | +7.59 |
| Level | Intermediate | Major | Intermediate | - | Major | Minor | Minor |
To determine price objectives, it is also possible to use the pivot points. Here is the price position in relation to pivot points:
| Pivot points | S3 | S2 | S1 | PP | R1 | R2 | R3 |
|---|---|---|---|---|---|---|---|
| Standard | 21.62 | 21.73 | 21.91 | 22.02 | 22.20 | 22.31 | 22.49 |
| Camarilla | 22.02 | 22.05 | 22.07 | 22.10 | 22.13 | 22.15 | 22.18 |
| Woodie | 21.67 | 21.75 | 21.96 | 22.04 | 22.25 | 22.33 | 22.54 |
| Fibonacci | 21.73 | 21.84 | 21.91 | 22.02 | 22.13 | 22.20 | 22.31 |
| Pivot points | S3 | S2 | S1 | PP | R1 | R2 | R3 |
|---|---|---|---|---|---|---|---|
| Standard | 20.61 | 21.20 | 21.56 | 22.16 | 22.52 | 23.11 | 23.47 |
| Camarilla | 21.66 | 21.75 | 21.83 | 21.92 | 22.01 | 22.10 | 22.18 |
| Woodie | 20.49 | 21.14 | 21.44 | 22.10 | 22.40 | 23.05 | 23.35 |
| Fibonacci | 21.20 | 21.57 | 21.79 | 22.16 | 22.52 | 22.75 | 23.11 |
| Pivot points | S3 | S2 | S1 | PP | R1 | R2 | R3 |
|---|---|---|---|---|---|---|---|
| Standard | 16.80 | 18.76 | 20.34 | 22.30 | 23.88 | 25.84 | 27.42 |
| Camarilla | 20.95 | 21.27 | 21.60 | 21.92 | 22.24 | 22.57 | 22.89 |
| Woodie | 16.61 | 18.67 | 20.15 | 22.21 | 23.69 | 25.74 | 27.23 |
| Fibonacci | 18.76 | 20.11 | 20.95 | 22.30 | 23.65 | 24.49 | 25.84 |
Numerical data
The following are the details of the technical indicators and moving averages that were collected to generate this technical analysis:
| RSI (14): | 56.37 | |
| MACD (12,26,9): | 0.1300 | |
| Directional Movement: | -1.21 | |
| AROON (14): | 0 | |
| DEMA (21): | 22.48 | |
| Parabolic SAR (0,02-0,02-0,2): | 23.50 | |
| Elder Ray (13): | 0.34 | |
| Super Trend (3,10): | 21.39 | |
| Zig ZAG (10): | 22.62 | |
| VORTEX (21): | 0.9000 | |
| Stochastique (14,3,5): | 49.61 | |
| TEMA (21): | 22.24 | |
| Williams %R (14): | -31.70 | |
| Chande Momentum Oscillator (20): | 0.01 | |
| Repulse (5,40,3): | 0.3700 | |
| ROCnROLL: | 1 | |
| TRIX (15,9): | 0.1300 | |
| Courbe Coppock: | 3.86 |
| MA7: | 22.27 | |
| MA20: | 22.38 | |
| MA50: | 21.61 | |
| MA100: | 20.33 | |
| MAexp7: | 22.29 | |
| MAexp20: | 22.24 | |
| MAexp50: | 21.61 | |
| MAexp100: | 20.49 | |
| Price / MA7: | +1.57% | |
| Price / MA20: | +1.07% | |
| Price / MA50: | +4.67% | |
| Price / MA100: | +11.26% | |
| Price / MAexp7: | +1.48% | |
| Price / MAexp20: | +1.71% | |
| Price / MAexp50: | +4.67% | |
| Price / MAexp100: | +10.40% |
News
The last news published on TOWER SEMICONDUCTOR at the time of the generation of this analysis was as follows:
- Inphi Qualified TowerJazz for Production of Advanced Silicon Photonics Integrated Circuits (PICS) for Data Center Connectivity
- TowerJazz to Maintain its TPSCo Majority Ownership, Control and Manufacturing Activity
- TowerJazz Schedules Third Quarter 2019 Financial Results and Conference Call
- TowerJazz Announces the Availability of its Newly Released Advanced Stacked BSI Hybrid Bonding Technology
- TowerJazz Announces its Annual Technical Global Symposium to be held in China, Japan and the US
About author

Online


Add a comment
Comments
0 comments on the analysis TOWER SEMICONDUCTOR - Daily