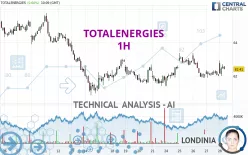
TOTALENERGIES - 1H - Technical analysis published on 06/28/2024 (GMT)
- 199
- 0
Click here for a new analysis!
- Timeframe : 1H
- - Analysis generated on
- Status : TARGET REACHED

Summary of the analysis

Additional analysis
Quotes
TOTALENERGIES rating 62.49 EUR. On the day, this instrument gained +0.73% with the lowest point at 61.99 EUR and the highest point at 62.92 EUR. The deviation from the price is +0.81% for the low point and -0.68% for the high point.A bullish gap was detected at the opening by the Central Gaps scanner. There are a lot of buyers and they have the upper hand in the very short term.
Opening Gap UP
Type : Bullish
Timeframe : Openning
So that you have an overall view of the price change, here is a table showing the variations over several periods:
Near a new LOW record (1 month)
Type : Bearish
Timeframe : Weekly
Technical
A technical analysis in 1H of this TOTALENERGIES chart shows a bullish trend. 78.57% of the signals given by moving averages are bullish. The overall trend seems to be showing some signs of weakness, as do the tentative bullish signals given by short-term moving averages. The Central Indicators market scanner is currently detecting a bullish signal that could impact this trend:
Bullish trend reversal : Moving Average 100
Type : Bullish
Timeframe : 1 hour
In fact, according to the parameters integrated into the Central Analyzer system, 11 technical indicators out of 18 analysed are currently bullish. But beware of excesses. The Central Indicators scanner currently detects this:
CCI indicator is overbought : over 100
Type : Neutral
Timeframe : 1 hour
Pivot points : price is over resistance 1
Type : Neutral
Timeframe : 1 hour
Ichimoku : price is over the cloud
Type : Bullish
Timeframe : 1 hour
Price is back over the pivot point
Type : Bullish
Timeframe : Weekly
Central Patterns, the market scanner focusing on chart patterns, resistances and supports found this result:
Near resistance of channel
Type : Bearish
Timeframe : 1 hour
No result was found by the Central Candlesticks scanner on Japanese candlesticks.
| S3 | S2 | S1 | Price | R1 | R2 | R3 | |
|---|---|---|---|---|---|---|---|
| ProTrendLines | 59.79 | 60.97 | 62.28 | 62.49 | 63.37 | 64.37 | 64.93 |
| Change (%) | -4.32% | -2.43% | -0.34% | - | +1.41% | +3.01% | +3.90% |
| Change | -2.70 | -1.52 | -0.21 | - | +0.88 | +1.88 | +2.44 |
| Level | Intermediate | Major | Major | - | Major | Minor | Minor |
To determine price objectives, it is also possible to use the pivot points. Here is the price position in relation to pivot points:
| Pivot points | S3 | S2 | S1 | PP | R1 | R2 | R3 |
|---|---|---|---|---|---|---|---|
| Standard | 61.35 | 61.61 | 61.83 | 62.09 | 62.31 | 62.57 | 62.79 |
| Camarilla | 61.91 | 61.95 | 62.00 | 62.04 | 62.08 | 62.13 | 62.17 |
| Woodie | 61.32 | 61.60 | 61.80 | 62.08 | 62.28 | 62.56 | 62.76 |
| Fibonacci | 61.61 | 61.80 | 61.91 | 62.09 | 62.28 | 62.39 | 62.57 |
| Pivot points | S3 | S2 | S1 | PP | R1 | R2 | R3 |
|---|---|---|---|---|---|---|---|
| Standard | 58.33 | 59.38 | 60.58 | 61.63 | 62.83 | 63.88 | 65.08 |
| Camarilla | 61.15 | 61.36 | 61.56 | 61.77 | 61.98 | 62.18 | 62.39 |
| Woodie | 58.40 | 59.42 | 60.65 | 61.67 | 62.90 | 63.92 | 65.15 |
| Fibonacci | 59.38 | 60.24 | 60.77 | 61.63 | 62.49 | 63.02 | 63.88 |
| Pivot points | S3 | S2 | S1 | PP | R1 | R2 | R3 |
|---|---|---|---|---|---|---|---|
| Standard | 59.76 | 61.90 | 64.04 | 66.18 | 68.32 | 70.46 | 72.60 |
| Camarilla | 64.99 | 65.39 | 65.78 | 66.17 | 66.56 | 66.96 | 67.35 |
| Woodie | 59.75 | 61.90 | 64.03 | 66.18 | 68.31 | 70.46 | 72.59 |
| Fibonacci | 61.90 | 63.54 | 64.55 | 66.18 | 67.82 | 68.83 | 70.46 |
Numerical data
The following is the status of the technical indicators and moving averages at the time of publication of this technical analysis:
| RSI (14): | 59.74 | |
| MACD (12,26,9): | -0.0100 | |
| Directional Movement: | 13.28 | |
| AROON (14): | 71.42 | |
| DEMA (21): | 62.26 | |
| Parabolic SAR (0,02-0,02-0,2): | 61.99 | |
| Elder Ray (13): | 0.29 | |
| Super Trend (3,10): | 62.79 | |
| Zig ZAG (10): | 62.57 | |
| VORTEX (21): | 0.9200 | |
| Stochastique (14,3,5): | 49.36 | |
| TEMA (21): | 62.22 | |
| Williams %R (14): | -28.85 | |
| Chande Momentum Oscillator (20): | 0.55 | |
| Repulse (5,40,3): | -0.0200 | |
| ROCnROLL: | 1 | |
| TRIX (15,9): | -0.0100 | |
| Courbe Coppock: | 0.14 |
| MA7: | 62.31 | |
| MA20: | 62.75 | |
| MA50: | 64.93 | |
| MA100: | 63.09 | |
| MAexp7: | 62.37 | |
| MAexp20: | 62.30 | |
| MAexp50: | 62.27 | |
| MAexp100: | 62.40 | |
| Price / MA7: | +0.29% | |
| Price / MA20: | -0.41% | |
| Price / MA50: | -3.76% | |
| Price / MA100: | -0.95% | |
| Price / MAexp7: | +0.19% | |
| Price / MAexp20: | +0.30% | |
| Price / MAexp50: | +0.35% | |
| Price / MAexp100: | +0.14% |
News
The latest news and videos published on TOTALENERGIES at the time of the analysis were as follows:
- Germany: TotalEnergies Wins Further Maritime Lease in the North Sea to Develop 1.5 GW of Offshore Wind
- TotalEnergies SE: Disclosure of Transactions in Own Shares
- Norway: TotalEnergies acquires a 40% interest in a CO2 Storage exploration license
- TotalEnergies SE: Disclosure of Transactions in Own Shares
- Australia: TotalEnergies Acquires a 26% Interest in the Cash-Maple Gas Discoveries for the Long-term Supply of Ichthys LNG
About author
Online


Add a comment
Comments
0 comments on the analysis TOTALENERGIES - 1H