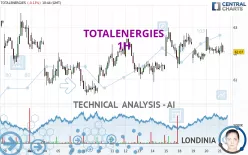
TOTALENERGIES - 1H - Technical analysis published on 12/21/2023 (GMT)
- 196
- 0
Click here for a new analysis!
- Timeframe : 1H
- - Analysis generated on
- Status : INVALID

Summary of the analysis

Additional analysis
Quotes
The TOTALENERGIES price is 62.06 EUR. The price registered a decrease of -0.15% on the session and was between 61.93 EUR and 62.43 EUR. This implies that the price is at +0.21% from its lowest and at -0.59% from its highest.The Central Gaps scanner detects a bearish opening. A small advantage for sellers in the very short term.
Bearish opening
Type : Bearish
Timeframe : Openning
A study of price movements over other periods shows the following variations:
Near a new HIGH record (5 years)
Type : Bullish
Timeframe : Weekly
Near a new HIGH record (1 year)
Type : Bullish
Timeframe : Weekly
Near a new HIGH record (1st january)
Type : Bullish
Timeframe : Weekly
Near a new LOW record (1 month)
Type : Bearish
Timeframe : Weekly
Technical
Technical analysis of this 1H chart of TOTALENERGIES indicates that the overall trend is bullish. 75.00% of the signals given by moving averages are bullish. Caution: the neutral signals currently given by short-term moving averages show us that the global trend is losing momentum. The Central Indicators market scanner currently does not detect any result that concerns moving averages.
An assessment of technical indicators does not currently provide any relevant information to suggest whether the signal given by the technical indicators is more bullish or bearish.
Caution: the Central Indicators scanner currently detects an excess:
MACD indicator: bearish divergence
Type : Bearish
Timeframe : 1 hour
MACD crosses DOWN its Moving Average
Type : Bearish
Timeframe : 1 hour
Price is back over the pivot point
Type : Bullish
Timeframe : Weekly
An analysis of the price chart with the Central Patterns scanner (detector of chart patterns and resistances and supports) shows a result that can have an impact on the price change:
Near support of triangle
Type : Bullish
Timeframe : 1 hour
The Central Candlesticks scanner which studies Japanese candlesticks did not detect anything.
| S3 | S2 | S1 | Price | R1 | R2 | R3 | |
|---|---|---|---|---|---|---|---|
| ProTrendLines | 60.69 | 61.32 | 61.71 | 62.06 | 62.30 | 62.60 | 62.98 |
| Change (%) | -2.21% | -1.19% | -0.56% | - | +0.39% | +0.87% | +1.48% |
| Change | -1.37 | -0.74 | -0.35 | - | +0.24 | +0.54 | +0.92 |
| Level | Major | Minor | Major | - | Intermediate | Intermediate | Intermediate |
Pivot points can also be used to set your price objectives. Here is the price situation in relation to pivot points:
| Pivot points | S3 | S2 | S1 | PP | R1 | R2 | R3 |
|---|---|---|---|---|---|---|---|
| Standard | 60.86 | 61.43 | 61.79 | 62.36 | 62.72 | 63.29 | 63.65 |
| Camarilla | 61.89 | 61.98 | 62.07 | 62.15 | 62.24 | 62.32 | 62.41 |
| Woodie | 60.76 | 61.38 | 61.69 | 62.31 | 62.62 | 63.24 | 63.55 |
| Fibonacci | 61.43 | 61.79 | 62.01 | 62.36 | 62.72 | 62.94 | 63.29 |
| Pivot points | S3 | S2 | S1 | PP | R1 | R2 | R3 |
|---|---|---|---|---|---|---|---|
| Standard | 58.62 | 59.76 | 60.70 | 61.84 | 62.78 | 63.92 | 64.86 |
| Camarilla | 61.06 | 61.25 | 61.44 | 61.63 | 61.82 | 62.01 | 62.20 |
| Woodie | 58.51 | 59.71 | 60.59 | 61.79 | 62.67 | 63.87 | 64.75 |
| Fibonacci | 59.76 | 60.56 | 61.05 | 61.84 | 62.64 | 63.13 | 63.92 |
| Pivot points | S3 | S2 | S1 | PP | R1 | R2 | R3 |
|---|---|---|---|---|---|---|---|
| Standard | 55.56 | 57.91 | 60.09 | 62.44 | 64.62 | 66.97 | 69.15 |
| Camarilla | 61.01 | 61.43 | 61.85 | 62.26 | 62.68 | 63.09 | 63.51 |
| Woodie | 55.47 | 57.87 | 60.00 | 62.40 | 64.53 | 66.93 | 69.06 |
| Fibonacci | 57.91 | 59.64 | 60.71 | 62.44 | 64.17 | 65.24 | 66.97 |
Numerical data
The following is the status of technical indicators and moving averages registered at the time this technical analysis was created:
| RSI (14): | 50.62 | |
| MACD (12,26,9): | 0.0200 | |
| Directional Movement: | 10.84 | |
| AROON (14): | 21.43 | |
| DEMA (21): | 62.17 | |
| Parabolic SAR (0,02-0,02-0,2): | 61.74 | |
| Elder Ray (13): | 0.08 | |
| Super Trend (3,10): | 62.78 | |
| Zig ZAG (10): | 62.13 | |
| VORTEX (21): | 0.9900 | |
| Stochastique (14,3,5): | 36.52 | |
| TEMA (21): | 62.14 | |
| Williams %R (14): | -67.24 | |
| Chande Momentum Oscillator (20): | 0.16 | |
| Repulse (5,40,3): | -0.0500 | |
| ROCnROLL: | 1 | |
| TRIX (15,9): | 0.0000 | |
| Courbe Coppock: | 0.43 |
| MA7: | 61.86 | |
| MA20: | 61.89 | |
| MA50: | 62.30 | |
| MA100: | 60.71 | |
| MAexp7: | 62.16 | |
| MAexp20: | 62.14 | |
| MAexp50: | 62.05 | |
| MAexp100: | 61.97 | |
| Price / MA7: | +0.32% | |
| Price / MA20: | +0.27% | |
| Price / MA50: | -0.39% | |
| Price / MA100: | +2.22% | |
| Price / MAexp7: | -0.16% | |
| Price / MAexp20: | -0.13% | |
| Price / MAexp50: | +0.02% | |
| Price / MAexp100: | +0.15% |
News
The last news published on TOTALENERGIES at the time of the generation of this analysis was as follows:
- Norway: TotalEnergies acquires a 40% interest in a CO2 Storage exploration license
- TotalEnergies SE: Disclosure of Transactions in Own Shares
- Australia: TotalEnergies Acquires a 26% Interest in the Cash-Maple Gas Discoveries for the Long-term Supply of Ichthys LNG
- TotalEnergies SE: Statement in compliance with the article 223-16 of the General Regulation of the Financial Markets Authority (Autorité des marchés financiers)
- TotalEnergies SE: Disclosure of Transactions in Own Shares
About author
Online


Add a comment
Comments
0 comments on the analysis TOTALENERGIES - 1H