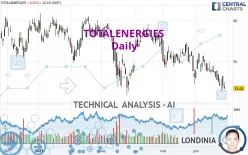
TOTALENERGIES - Daily - Technical analysis published on 06/28/2023 (GMT)
- 260
- 0
Click here for a new analysis!
- Timeframe : Daily
- - Analysis generated on
- Status : INVALID

Summary of the analysis

Additional analysis
Quotes
The TOTALENERGIES price is 51.680 EUR. The price is lower by -0.62% since the last closing with the lowest point at 51.610 EUR and the highest point at 52.450 EUR. The deviation from the price is +0.14% for the low point and -1.47% for the high point.A bearish opening was detected by the Central Gaps scanner. Sellers are trying to impose a bearish trend in the very short term.
Bearish opening
Type : Bearish
Timeframe : Openning
So that you have an overall view of the price change, here is a table showing the variations over several periods:
Near a new LOW record (1st january)
Type : Bearish
Timeframe : Weekly
Near a new LOW record (1 month)
Type : Bearish
Timeframe : Weekly
Technical
A technical analysis in Daily of this TOTALENERGIES chart shows a sharp bearish trend. The signals given by moving averages are 92.86% bearish. This strong bearish trend is confirmed by the strong signals currently being given by short-term moving averages. There is no crossing of moving average by the price or crossing of moving averages between themselves.
An assessment of technical indicators shows a strong bearish signal.
Caution: the Central Indicators scanner currently detects an excess:
CCI indicator is oversold : under -100
Type : Neutral
Timeframe : Daily
Williams %R indicator is oversold : under -80
Type : Neutral
Timeframe : Daily
An analysis of the price chart with the Central Patterns scanner (detector of chart patterns and resistances and supports) shows several results that can have an impact on the price change:
Near horizontal support
Type : Bullish
Timeframe : Daily
Support of channel is broken
Type : Bearish
Timeframe : Daily
Support of triangle is broken
Type : Bearish
Timeframe : Daily
The Central Candlesticks scanner, specialised in Japanese candlesticks, did not identify any signals.
| S3 | S2 | S1 | Price | R1 | R2 | R3 | |
|---|---|---|---|---|---|---|---|
| ProTrendLines | 44.518 | 47.624 | 51.088 | 51.680 | 52.635 | 53.785 | 56.179 |
| Change (%) | -13.86% | -7.85% | -1.15% | - | +1.85% | +4.07% | +8.71% |
| Change | -7.162 | -4.056 | -0.592 | - | +0.955 | +2.105 | +4.499 |
| Level | Minor | Minor | Major | - | Major | Major | Minor |
To determine price objectives, it is also possible to use the pivot points. Here is the price position in relation to pivot points:
| Pivot points | S3 | S2 | S1 | PP | R1 | R2 | R3 |
|---|---|---|---|---|---|---|---|
| Standard | 49.630 | 50.600 | 51.300 | 52.270 | 52.970 | 53.940 | 54.640 |
| Camarilla | 51.541 | 51.694 | 51.847 | 52.000 | 52.153 | 52.306 | 52.459 |
| Woodie | 49.495 | 50.533 | 51.165 | 52.203 | 52.835 | 53.873 | 54.505 |
| Fibonacci | 50.600 | 51.238 | 51.632 | 52.270 | 52.908 | 53.302 | 53.940 |
| Pivot points | S3 | S2 | S1 | PP | R1 | R2 | R3 |
|---|---|---|---|---|---|---|---|
| Standard | 49.367 | 50.643 | 51.347 | 52.623 | 53.327 | 54.603 | 55.307 |
| Camarilla | 51.506 | 51.687 | 51.869 | 52.050 | 52.232 | 52.413 | 52.595 |
| Woodie | 49.080 | 50.500 | 51.060 | 52.480 | 53.040 | 54.460 | 55.020 |
| Fibonacci | 50.643 | 51.400 | 51.867 | 52.623 | 53.380 | 53.847 | 54.603 |
| Pivot points | S3 | S2 | S1 | PP | R1 | R2 | R3 |
|---|---|---|---|---|---|---|---|
| Standard | 44.616 | 48.074 | 50.207 | 53.665 | 55.798 | 59.256 | 61.389 |
| Camarilla | 50.803 | 51.315 | 51.828 | 52.340 | 52.853 | 53.365 | 53.878 |
| Woodie | 43.954 | 47.743 | 49.545 | 53.334 | 55.136 | 58.925 | 60.727 |
| Fibonacci | 48.074 | 50.210 | 51.529 | 53.665 | 55.801 | 57.120 | 59.256 |
Numerical data
The following are the details of the technical indicators and moving averages that were collected to generate this technical analysis:
| RSI (14): | 39.03 | |
| MACD (12,26,9): | -0.6530 | |
| Directional Movement: | -7.879 | |
| AROON (14): | -85.714 | |
| DEMA (21): | 52.244 | |
| Parabolic SAR (0,02-0,02-0,2): | 53.797 | |
| Elder Ray (13): | -0.700 | |
| Super Trend (3,10): | 55.539 | |
| Zig ZAG (10): | 51.700 | |
| VORTEX (21): | 0.8860 | |
| Stochastique (14,3,5): | 22.00 | |
| TEMA (21): | 52.004 | |
| Williams %R (14): | -88.09 | |
| Chande Momentum Oscillator (20): | -1.518 | |
| Repulse (5,40,3): | -3.1420 | |
| ROCnROLL: | 2 | |
| TRIX (15,9): | -0.1510 | |
| Courbe Coppock: | 5.16 |
| MA7: | 52.440 | |
| MA20: | 53.180 | |
| MA50: | 54.441 | |
| MA100: | 55.138 | |
| MAexp7: | 52.344 | |
| MAexp20: | 53.079 | |
| MAexp50: | 54.017 | |
| MAexp100: | 54.444 | |
| Price / MA7: | -1.45% | |
| Price / MA20: | -2.82% | |
| Price / MA50: | -5.07% | |
| Price / MA100: | -6.27% | |
| Price / MAexp7: | -1.27% | |
| Price / MAexp20: | -2.64% | |
| Price / MAexp50: | -4.33% | |
| Price / MAexp100: | -5.08% |
News
The latest news and videos published on TOTALENERGIES at the time of the analysis were as follows:
- TotalEnergies SE: Disclosure of Transactions in Own Shares
- Energy transition & Renewables: TotalEnergies partners with Petronas in Asia-Pacific
- TotalEnergies Partners with Petronas and Mitsui on a Carbon Storage Hub in Malaysia
- Aramco and TotalEnergies Award Contracts for $11 billion Amiral Project
- Germany: TotalEnergies and VNG Join Forces on Green Hydrogen to Decarbonize the Leuna Refinery
About author
Online


Add a comment
Comments
0 comments on the analysis TOTALENERGIES - Daily