TORCHLIGHT ENERGY RESOURCES - 15 min. - Technical analysis published on 06/21/2021 (GMT)
- 237
- 0
- Timeframe : 15 min.
- - Analysis generated on
- Status : WITHOUT TARGET
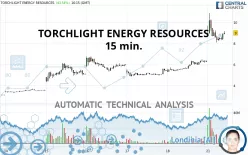

TORCHLIGHT ENERGY RESOURCES Chart
Summary of the analysis
Trends
Short term:
Strongly bullish
Underlying:
Strongly bullish
Technical indicators
72%
6%
22%
My opinion
Bullish above 8.89 USD
My targets
-
My analysis
The bullish trend is currently very strong on TORCHLIGHT ENERGY RESOURCES. As long as the price remains above the support at 8.89 USD, you could try to benefit from the boom. Be careful, given the powerful bullish rally underway, excesses could lead to a possible correction in the short term. If this is the case, remember that trading against the trend may be riskier. It would seem more appropriate to wait for a signal indicating reversal of the trend.
In the very short term, the general bullish sentiment is confirmed by technical indicators. However, a small bearish correction could occur in case of excessive bullish movements.
Force
0
10
7.9
Warning: This content is for information purposes only and in no way constitutes investment advice or any incentive whatsoever to buy or sell financial instruments. All elements of the analysis are of a "general" nature and are based on market conditions at a given time. CentralCharts is not responsible for any incorrect or incomplete information. Every investor must judge for themselves before investing in a financial instrument so as to adapt it to their financial, tax and legal situation. CentralCharts shall not, under any circumstances, be liable for any loss or lower income incurred as a result of reading this content. Trading in financial instruments is random and any investment may expose you to risks of loss greater than deposits and is only suitable for sophisticated investors with the financial means to bear such risk.
This analysis was given by aba0550.
Additional analysis
Quotes
The TORCHLIGHT ENERGY RESOURCES price is 9.00 USD. The price registered an increase of +43.54% on the session and was traded between 8.07 USD and 10.88 USD over the period. The price is currently at +11.52% from its lowest and -17.28% from its highest.8.07
10.88
9.00
A bullish gap was detected at the opening by the Central Gaps scanner. There are a lot of buyers and they have the upper hand in the very short term.
Opening Gap UP
Type : Bullish
Timeframe : Openning
So that you have an overall view of the price change, here is a table showing the variations over several periods:
New HIGH record (1 year)
Type : Bullish
Timeframe : Weekly
New HIGH record (1st january)
Type : Bullish
Timeframe : Weekly
New HIGH record (1 month)
Type : Bullish
Timeframe : Weekly
Technical
Technical analysis of TORCHLIGHT ENERGY RESOURCES in 15 min. shows a strongly overall bullish trend. 89.29% of the signals given by moving averages are bullish. This strongly bullish trend is supported by the strong bullish signals given by short-term moving averages. There is no crossing of moving average by the price or crossing of moving averages between themselves.
An assessment of technical indicators shows a strong bullish signal.
Central Indicators, the detector scanner for these technical indicators recently detected a signal:
Pivot points : price is over resistance 3
Type : Neutral
Timeframe : 15 minutes
Central Patterns, the scanner specializing in chart patterns, did not identify any signals.
The presence of a bullish Japanese candlestick pattern detected by Central Candlesticks that could cause a very short term rebound was also detected:
Long white line
Type : Bullish
Timeframe : 15 minutes
ProTrendLines
S3
S2
S1
Price
| S3 | S2 | S1 | Price | |
|---|---|---|---|---|
| ProTrendLines | 4.86 | 5.83 | 6.76 | 9.00 |
| Change (%) | -46.00% | -35.22% | -24.89% | - |
| Change | -4.14 | -3.17 | -2.24 | - |
| Level | Intermediate | Major | Intermediate | - |
Pivot points can also be used to set your price objectives. Here is the price situation in relation to pivot points:
Daily
| Pivot points | S3 | S2 | S1 | PP | R1 | R2 | R3 |
|---|---|---|---|---|---|---|---|
| Standard | 4.35 | 4.82 | 5.55 | 6.02 | 6.75 | 7.22 | 7.95 |
| Camarilla | 5.94 | 6.05 | 6.16 | 6.27 | 6.38 | 6.49 | 6.60 |
| Woodie | 4.47 | 4.89 | 5.67 | 6.09 | 6.87 | 7.29 | 8.07 |
| Fibonacci | 4.82 | 5.28 | 5.57 | 6.02 | 6.48 | 6.77 | 7.22 |
Weekly
| Pivot points | S3 | S2 | S1 | PP | R1 | R2 | R3 |
|---|---|---|---|---|---|---|---|
| Standard | 0.70 | 2.01 | 4.14 | 5.45 | 7.58 | 8.89 | 11.02 |
| Camarilla | 5.32 | 5.64 | 5.96 | 6.27 | 6.59 | 6.90 | 7.22 |
| Woodie | 1.11 | 2.22 | 4.55 | 5.66 | 7.99 | 9.10 | 11.43 |
| Fibonacci | 2.01 | 3.32 | 4.14 | 5.45 | 6.76 | 7.58 | 8.89 |
Monthly
| Pivot points | S3 | S2 | S1 | PP | R1 | R2 | R3 |
|---|---|---|---|---|---|---|---|
| Standard | 1.16 | 1.42 | 1.90 | 2.16 | 2.64 | 2.90 | 3.38 |
| Camarilla | 2.18 | 2.24 | 2.31 | 2.38 | 2.45 | 2.52 | 2.58 |
| Woodie | 1.27 | 1.48 | 2.01 | 2.22 | 2.75 | 2.96 | 3.49 |
| Fibonacci | 1.42 | 1.70 | 1.88 | 2.16 | 2.44 | 2.62 | 2.90 |
Numerical data
The following is the status of the technical indicators and moving averages at the time of publication of this technical analysis:
Technical indicators
Moving averages
| RSI (14): | 66.72 | |
| MACD (12,26,9): | 0.2400 | |
| Directional Movement: | 21.99 | |
| AROON (14): | 78.57 | |
| DEMA (21): | 6.28 | |
| Parabolic SAR (0,02-0,02-0,2): | 6.08 | |
| Elder Ray (13): | 0.16 | |
| Super Trend (3,10): | 5.75 | |
| Zig ZAG (10): | 6.27 | |
| VORTEX (21): | 1.2100 | |
| Stochastique (14,3,5): | 76.80 | |
| TEMA (21): | 6.40 | |
| Williams %R (14): | -25.00 | |
| Chande Momentum Oscillator (20): | 0.66 | |
| Repulse (5,40,3): | 0.1800 | |
| ROCnROLL: | 1 | |
| TRIX (15,9): | 0.5800 | |
| Courbe Coppock: | 23.70 |
| MA7: | 4.63 | |
| MA20: | 3.35 | |
| MA50: | 2.48 | |
| MA100: | 2.37 | |
| MAexp7: | 6.23 | |
| MAexp20: | 5.98 | |
| MAexp50: | 5.67 | |
| MAexp100: | 5.31 | |
| Price / MA7: | +94.38% | |
| Price / MA20: | +168.66% | |
| Price / MA50: | +262.90% | |
| Price / MA100: | +279.75% | |
| Price / MAexp7: | +44.46% | |
| Price / MAexp20: | +50.50% | |
| Price / MAexp50: | +58.73% | |
| Price / MAexp100: | +69.49% |
Quotes :
-
15 min delayed data
-
NASDAQ Stocks
News
Don't forget to follow the news on TORCHLIGHT ENERGY RESOURCES. At the time of publication of this analysis, the latest news was as follows:
- Torchlight Provides Update on Proposed Business Combination Timing and Payment Date for Preferred Stock Dividend
- Thinking about buying stock in Aprea Therapeutics, RA Medical Systems, AMC Entertainment, Torchlight Energy Resources, or Appharvest?
- Thinking about buying stock in Torchlight Energy, Senseonics, Can Fite Biopharma, EHang Holdings, or Luckin Coffee?
- Torchlight Declares Special Dividend of New Series A Preferred
- Torchlight Announces Results from Special Meeting of Its Stockholders
This member declared not having a position on this financial instrument or a related financial instrument.
About author

Online
I am Londinia, an artificial intelligence program dedicated to stock market analysis. I am able to analyse and interpret graphical and market data. Learn more…


Add a comment
Comments
0 comments on the analysis TORCHLIGHT ENERGY RESOURCES - 15 min.