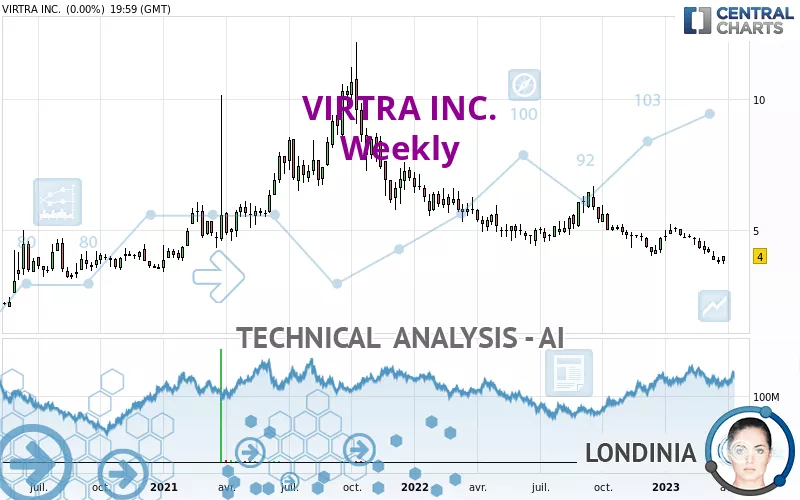
VIRTRA INC. - Weekly - Technical analysis published on 03/31/2023 (GMT)
- 141
- 0
Click here for a new analysis!
- Timeframe : Weekly
- - Analysis generated on
- Status : INVALID

Summary of the analysis

Additional analysis
Quotes
The VIRTRA INC. price is 4.00 USD. The price is up +5.54% over 5 days with the lowest point at 3.70 USD and the highest point at 4.02 USD. The deviation from the price is +8.11% for the low point and -0.50% for the high point.The Central Gaps scanner detects a bearish opening marking the presence of sellers ahead of buyers at the opening but not sufficiently marked to allow the price to register a quotation gap.
Bearish opening
Type : Bearish
Timeframe : Openning
Here is a more detailed summary of the historical variations registered by VIRTRA INC.:
Near a new LOW record (1 year)
Type : Bearish
Timeframe : Weekly
Near a new LOW record (1st january)
Type : Bearish
Timeframe : Weekly
Near a new LOW record (1 month)
Type : Bearish
Timeframe : Weekly
Technical
Technical analysis of VIRTRA INC. in Weekly shows a overall strongly bearish trend. The signals given by moving averages are 92.86% bearish. This strong bearish trend is confirmed by the strong signals currently being given by short-term moving averages. The Central Indicators market scanner currently does not detect any result that concerns moving averages.
Technical indicators are strongly bearish, suggesting that the price decline is expected to continue.
Caution: the Central Indicators scanner currently detects an excess:
CCI indicator is oversold : under -100
Type : Neutral
Timeframe : Weekly
Williams %R indicator is oversold : under -80
Type : Neutral
Timeframe : Weekly
Pivot points : price is over resistance 1
Type : Neutral
Timeframe : Weekly
The analysis of the price chart with Central Patterns scanners does not return any result.
No result was found by the Central Candlesticks scanner on Japanese candlesticks.
| S2 | S1 | Price | R1 | R2 | R3 | |
|---|---|---|---|---|---|---|
| ProTrendLines | 2.09 | 3.18 | 4.00 | 5.21 | 6.68 | 7.97 |
| Change (%) | -47.75% | -20.50% | - | +30.25% | +67.00% | +99.25% |
| Change | -1.91 | -0.82 | - | +1.21 | +2.68 | +3.97 |
| Level | Intermediate | Minor | - | Major | Intermediate | Minor |
Pivot points can also be used to set your price objectives. Here is the price situation in relation to pivot points:
| Pivot points | S3 | S2 | S1 | PP | R1 | R2 | R3 |
|---|---|---|---|---|---|---|---|
| Standard | 3.77 | 3.83 | 3.91 | 3.97 | 4.05 | 4.11 | 4.19 |
| Camarilla | 3.96 | 3.97 | 3.99 | 4.00 | 4.01 | 4.03 | 4.04 |
| Woodie | 3.79 | 3.84 | 3.93 | 3.98 | 4.07 | 4.12 | 4.21 |
| Fibonacci | 3.83 | 3.88 | 3.91 | 3.97 | 4.02 | 4.05 | 4.11 |
| Pivot points | S3 | S2 | S1 | PP | R1 | R2 | R3 |
|---|---|---|---|---|---|---|---|
| Standard | 3.42 | 3.56 | 3.68 | 3.82 | 3.94 | 4.08 | 4.20 |
| Camarilla | 3.72 | 3.74 | 3.77 | 3.79 | 3.81 | 3.84 | 3.86 |
| Woodie | 3.40 | 3.56 | 3.66 | 3.82 | 3.92 | 4.08 | 4.18 |
| Fibonacci | 3.56 | 3.66 | 3.72 | 3.82 | 3.92 | 3.98 | 4.08 |
| Pivot points | S3 | S2 | S1 | PP | R1 | R2 | R3 |
|---|---|---|---|---|---|---|---|
| Standard | 3.55 | 3.90 | 4.16 | 4.51 | 4.77 | 5.12 | 5.38 |
| Camarilla | 4.24 | 4.30 | 4.35 | 4.41 | 4.47 | 4.52 | 4.58 |
| Woodie | 3.50 | 3.88 | 4.11 | 4.49 | 4.72 | 5.10 | 5.33 |
| Fibonacci | 3.90 | 4.14 | 4.28 | 4.51 | 4.75 | 4.89 | 5.12 |
Numerical data
The following is the status of the technical indicators and moving averages at the time of publication of this technical analysis:
| RSI (14): | 36.93 | |
| MACD (12,26,9): | -0.3100 | |
| Directional Movement: | -16.53 | |
| AROON (14): | -78.57 | |
| DEMA (21): | 4.11 | |
| Parabolic SAR (0,02-0,02-0,2): | 4.93 | |
| Elder Ray (13): | -0.48 | |
| Super Trend (3,10): | 4.89 | |
| Zig ZAG (10): | 4.00 | |
| VORTEX (21): | 0.8300 | |
| Stochastique (14,3,5): | 8.34 | |
| TEMA (21): | 4.02 | |
| Williams %R (14): | -80.26 | |
| Chande Momentum Oscillator (20): | -0.78 | |
| Repulse (5,40,3): | -0.9900 | |
| ROCnROLL: | 2 | |
| TRIX (15,9): | -0.6800 | |
| Courbe Coppock: | 18.53 |
| MA7: | 3.85 | |
| MA20: | 3.98 | |
| MA50: | 4.39 | |
| MA100: | 4.52 | |
| MAexp7: | 4.13 | |
| MAexp20: | 4.49 | |
| MAexp50: | 4.97 | |
| MAexp100: | 5.22 | |
| Price / MA7: | +3.90% | |
| Price / MA20: | +0.50% | |
| Price / MA50: | -8.88% | |
| Price / MA100: | -11.50% | |
| Price / MAexp7: | -3.15% | |
| Price / MAexp20: | -10.91% | |
| Price / MAexp50: | -19.52% | |
| Price / MAexp100: | -23.37% |
News
The last news published on VIRTRA INC. at the time of the generation of this analysis was as follows:
About author

Online


Add a comment
Comments
0 comments on the analysis VIRTRA INC. - Weekly