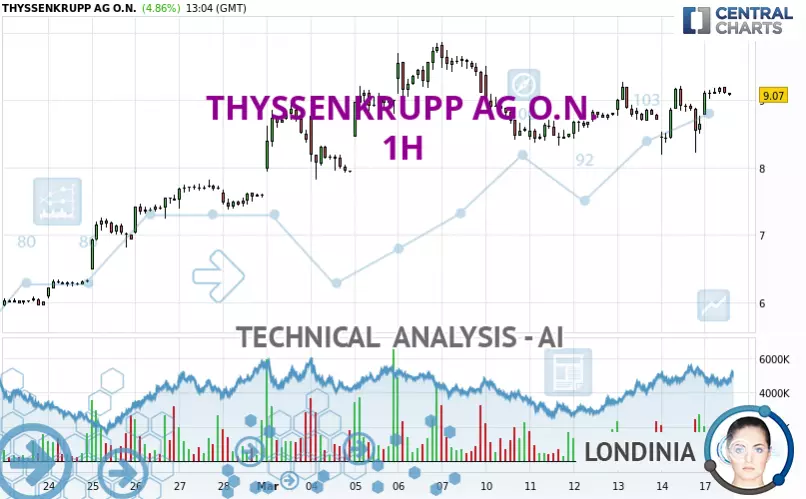
THYSSENKRUPP AG O.N. - 1H - Technical analysis published on 03/17/2025 (GMT)
- 118
- 0
Click here for a new analysis!
- Timeframe : 1H
- - Analysis generated on
- Status : TARGET REACHED
Summary of the analysis

Additional analysis
Quotes
The THYSSENKRUPP AG O.N. rating is 9.070 EUR. The price registered an increase of +4.86% on the session with the lowest point at 8.778 EUR and the highest point at 9.200 EUR. The deviation from the price is +3.33% for the low point and -1.41% for the high point.The Central Gaps scanner detects a bullish opening. A small advantage for buyers in the very short term.
Bullish opening
Type : Bullish
Timeframe : Openning
So that you have an overall view of the price change, here is a table showing the variations over several periods:
Abnormal volumes
Timeframe : 5 days
Abnormal volumes
Timeframe : 20 days
Technical
Technical analysis of THYSSENKRUPP AG O.N. in 1H shows a strongly overall bullish trend. The signals given by the moving averages are 85.71% bullish. This strong bullish trend is confirmed by the strong signals currently being given by short-term moving averages. There is no crossing of moving average by the price or crossing of moving averages between themselves.
In fact, 14 technical indicators on 18 studied are currently positioned bullish. But beware of excesses. The Central Indicators scanner currently detects this:
CCI indicator is overbought : over 100
Type : Neutral
Timeframe : 1 hour
CCI indicator: bearish divergence
Type : Bearish
Timeframe : 1 hour
Williams %R indicator is overbought : over -20
Type : Neutral
Timeframe : 1 hour
Central Patterns, the market scanner focusing on chart patterns, resistances and supports found this result:
Near resistance of channel
Type : Bearish
Timeframe : 1 hour
The Central Candlesticks scanner which studies Japanese candlesticks did not detect anything.
| S3 | S2 | S1 | Price | R1 | R2 | R3 | |
|---|---|---|---|---|---|---|---|
| ProTrendLines | 6.084 | 7.239 | 8.421 | 9.070 | 9.374 | 9.860 | 10.438 |
| Change (%) | -32.92% | -20.19% | -7.16% | - | +3.35% | +8.71% | +15.08% |
| Change | -2.986 | -1.831 | -0.649 | - | +0.304 | +0.790 | +1.368 |
| Level | Intermediate | Major | Intermediate | - | Major | Minor | Major |
Attention could also be paid to pivot points to set price objectives:
| Pivot points | S3 | S2 | S1 | PP | R1 | R2 | R3 |
|---|---|---|---|---|---|---|---|
| Standard | 7.127 | 7.655 | 8.153 | 8.681 | 9.179 | 9.707 | 10.205 |
| Camarilla | 8.368 | 8.462 | 8.556 | 8.650 | 8.744 | 8.838 | 8.932 |
| Woodie | 7.111 | 7.648 | 8.137 | 8.674 | 9.163 | 9.700 | 10.189 |
| Fibonacci | 7.655 | 8.047 | 8.289 | 8.681 | 9.073 | 9.315 | 9.707 |
| Pivot points | S3 | S2 | S1 | PP | R1 | R2 | R3 |
|---|---|---|---|---|---|---|---|
| Standard | 6.743 | 7.463 | 8.057 | 8.777 | 9.371 | 10.091 | 10.685 |
| Camarilla | 8.289 | 8.409 | 8.530 | 8.650 | 8.771 | 8.891 | 9.011 |
| Woodie | 6.679 | 7.432 | 7.993 | 8.746 | 9.307 | 10.060 | 10.621 |
| Fibonacci | 7.463 | 7.965 | 8.275 | 8.777 | 9.279 | 9.589 | 10.091 |
| Pivot points | S3 | S2 | S1 | PP | R1 | R2 | R3 |
|---|---|---|---|---|---|---|---|
| Standard | 1.935 | 3.157 | 5.381 | 6.603 | 8.827 | 10.049 | 12.273 |
| Camarilla | 6.656 | 6.972 | 7.288 | 7.604 | 7.920 | 8.236 | 8.552 |
| Woodie | 2.435 | 3.408 | 5.881 | 6.854 | 9.327 | 10.300 | 12.773 |
| Fibonacci | 3.157 | 4.474 | 5.287 | 6.603 | 7.920 | 8.733 | 10.049 |
Numerical data
The following are the details of the technical indicators and moving averages that were collected to generate this technical analysis:
| RSI (14): | 57.57 | |
| MACD (12,26,9): | 0.0410 | |
| Directional Movement: | 1.270 | |
| AROON (14): | 28.572 | |
| DEMA (21): | 8.874 | |
| Parabolic SAR (0,02-0,02-0,2): | 9.152 | |
| Elder Ray (13): | 0.265 | |
| Super Trend (3,10): | 8.346 | |
| Zig ZAG (10): | 9.144 | |
| VORTEX (21): | 1.0870 | |
| Stochastique (14,3,5): | 75.57 | |
| TEMA (21): | 8.921 | |
| Williams %R (14): | -9.36 | |
| Chande Momentum Oscillator (20): | 0.340 | |
| Repulse (5,40,3): | 2.9290 | |
| ROCnROLL: | 1 | |
| TRIX (15,9): | 0.0220 | |
| Courbe Coppock: | 1.45 |
| MA7: | 8.779 | |
| MA20: | 7.823 | |
| MA50: | 5.718 | |
| MA100: | 4.652 | |
| MAexp7: | 8.902 | |
| MAexp20: | 8.834 | |
| MAexp50: | 8.783 | |
| MAexp100: | 8.461 | |
| Price / MA7: | +3.31% | |
| Price / MA20: | +15.94% | |
| Price / MA50: | +58.62% | |
| Price / MA100: | +94.97% | |
| Price / MAexp7: | +1.89% | |
| Price / MAexp20: | +2.67% | |
| Price / MAexp50: | +3.27% | |
| Price / MAexp100: | +7.20% |
News
The last news published on THYSSENKRUPP AG O.N. at the time of the generation of this analysis was as follows:
- EQS-Adhoc: thyssenkrupp AG: thyssenkrupp AG adjusts outlook for FY 2023/24
- EQS-Adhoc: thyssenkrupp AG: thyssenkrupp and EP Corporate Group enter into strategic partnership
- BWI Group and thyssenkrupp Steering partner in EMB to lead world's chassis-by-wire technology
- TCC Joins Hands with Germany's thyssenkrupp Polysius to Develop Innovative Carbon Capture Technology with Separate Oxyfuel Calciner
-
 Look Ahead 22/11/23: Euro zone consumer confidence; US durable goods; Britvic; Sage; ThyssenKrupp
About author
Online


Add a comment
Comments
0 comments on the analysis THYSSENKRUPP AG O.N. - 1H