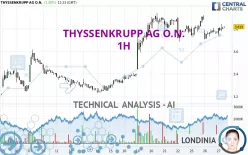
THYSSENKRUPP AG O.N. - 1H - Technical analysis published on 11/27/2024 (GMT)
- 113
- 0
Click here for a new analysis!
- Timeframe : 1H
- - Analysis generated on
- Status : TARGET REACHED

Summary of the analysis

Additional analysis
Quotes
The THYSSENKRUPP AG O.N. rating is 3.819 EUR. The price registered an increase of +1.30% on the session and was traded between 3.734 EUR and 3.843 EUR over the period. The price is currently at +2.28% from its lowest and -0.62% from its highest.A bearish opening was detected by the Central Gaps scanner. Sellers are trying to impose a bearish trend in the very short term.
Bearish opening
Type : Bearish
Timeframe : Openning
Here is a more detailed summary of the historical variations registered by THYSSENKRUPP AG O.N.:
Near a new HIGH record (1 month)
Type : Bullish
Timeframe : Weekly
Technical
Technical analysis of THYSSENKRUPP AG O.N. in 1H shows a strongly overall bullish trend. 82.14% of the signals given by moving averages are bullish. This strongly bullish trend is supported by the strong bullish signals given by short-term moving averages. The Central Indicators scanner detects a bearish signal on moving averages that could impact this trend:
Bearish price crossover with adaptative moving average 50
Type : Bearish
Timeframe : 1 hour
On the 18 technical indicators analysed, 8 are bullish, 6 are neutral and 4 are bearish. Other results related to technical indicators were also found by the Central Indicators scanner:
Pivot points : price is over resistance 1
Type : Neutral
Timeframe : 1 hour
Williams %R indicator is back over -50
Type : Bullish
Timeframe : 1 hour
The Central Patterns scanner, which studies chart patterns, resistances and supports, has identified this signal:
Near horizontal resistance
Type : Bearish
Timeframe : 1 hour
No result was found by the Central Candlesticks scanner on Japanese candlesticks.
| S3 | S2 | S1 | Price | R1 | R2 | R3 | |
|---|---|---|---|---|---|---|---|
| ProTrendLines | 3.246 | 3.481 | 3.706 | 3.819 | 3.837 | 3.940 | 4.030 |
| Change (%) | -15.00% | -8.85% | -2.96% | - | +0.47% | +3.17% | +5.53% |
| Change | -0.573 | -0.338 | -0.113 | - | +0.018 | +0.121 | +0.211 |
| Level | Intermediate | Major | Intermediate | - | Minor | Major | Intermediate |
Pivot points can also be used to set your price objectives. Here is the price situation in relation to pivot points:
| Pivot points | S3 | S2 | S1 | PP | R1 | R2 | R3 |
|---|---|---|---|---|---|---|---|
| Standard | 3.613 | 3.659 | 3.715 | 3.761 | 3.817 | 3.863 | 3.919 |
| Camarilla | 3.742 | 3.751 | 3.761 | 3.770 | 3.779 | 3.789 | 3.798 |
| Woodie | 3.617 | 3.662 | 3.719 | 3.764 | 3.821 | 3.866 | 3.923 |
| Fibonacci | 3.659 | 3.698 | 3.722 | 3.761 | 3.800 | 3.824 | 3.863 |
| Pivot points | S3 | S2 | S1 | PP | R1 | R2 | R3 |
|---|---|---|---|---|---|---|---|
| Standard | 2.853 | 3.098 | 3.449 | 3.694 | 4.045 | 4.290 | 4.641 |
| Camarilla | 3.635 | 3.690 | 3.744 | 3.799 | 3.854 | 3.908 | 3.963 |
| Woodie | 2.905 | 3.125 | 3.501 | 3.721 | 4.097 | 4.317 | 4.693 |
| Fibonacci | 3.098 | 3.326 | 3.467 | 3.694 | 3.922 | 4.063 | 4.290 |
| Pivot points | S3 | S2 | S1 | PP | R1 | R2 | R3 |
|---|---|---|---|---|---|---|---|
| Standard | 2.519 | 2.806 | 3.004 | 3.291 | 3.489 | 3.776 | 3.974 |
| Camarilla | 3.070 | 3.114 | 3.159 | 3.203 | 3.248 | 3.292 | 3.336 |
| Woodie | 2.476 | 2.784 | 2.961 | 3.269 | 3.446 | 3.754 | 3.931 |
| Fibonacci | 2.806 | 2.991 | 3.105 | 3.291 | 3.476 | 3.590 | 3.776 |
Numerical data
The following are the details of the technical indicators and moving averages that were collected to generate this technical analysis:
| RSI (14): | 53.51 | |
| MACD (12,26,9): | 0.0020 | |
| Directional Movement: | 5.951 | |
| AROON (14): | -7.143 | |
| DEMA (21): | 3.796 | |
| Parabolic SAR (0,02-0,02-0,2): | 3.879 | |
| Elder Ray (13): | 0.013 | |
| Super Trend (3,10): | 3.898 | |
| Zig ZAG (10): | 3.812 | |
| VORTEX (21): | 1.1570 | |
| Stochastique (14,3,5): | 43.98 | |
| TEMA (21): | 3.780 | |
| Williams %R (14): | -50.93 | |
| Chande Momentum Oscillator (20): | 0.101 | |
| Repulse (5,40,3): | 0.7310 | |
| ROCnROLL: | 1 | |
| TRIX (15,9): | -0.0090 | |
| Courbe Coppock: | 1.53 |
| MA7: | 3.832 | |
| MA20: | 3.496 | |
| MA50: | 3.378 | |
| MA100: | 3.365 | |
| MAexp7: | 3.795 | |
| MAexp20: | 3.793 | |
| MAexp50: | 3.755 | |
| MAexp100: | 3.656 | |
| Price / MA7: | -0.34% | |
| Price / MA20: | +9.24% | |
| Price / MA50: | +13.06% | |
| Price / MA100: | +13.49% | |
| Price / MAexp7: | +0.63% | |
| Price / MAexp20: | +0.69% | |
| Price / MAexp50: | +1.70% | |
| Price / MAexp100: | +4.46% |
News
The last news published on THYSSENKRUPP AG O.N. at the time of the generation of this analysis was as follows:
- EQS-Adhoc: thyssenkrupp AG: thyssenkrupp AG adjusts outlook for FY 2023/24
- EQS-Adhoc: thyssenkrupp AG: thyssenkrupp and EP Corporate Group enter into strategic partnership
- BWI Group and thyssenkrupp Steering partner in EMB to lead world's chassis-by-wire technology
- TCC Joins Hands with Germany's thyssenkrupp Polysius to Develop Innovative Carbon Capture Technology with Separate Oxyfuel Calciner
-
 Look Ahead 22/11/23: Euro zone consumer confidence; US durable goods; Britvic; Sage; ThyssenKrupp
About author
Online


Add a comment
Comments
0 comments on the analysis THYSSENKRUPP AG O.N. - 1H