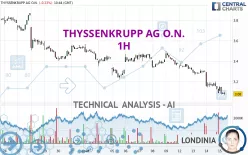
THYSSENKRUPP AG O.N. - 1H - Technical analysis published on 08/15/2024 (GMT)
- 165
- 0
Click here for a new analysis!
- Timeframe : 1H
- - Analysis generated on
- Status : LEVEL MAINTAINED

Summary of the analysis

Additional analysis
Quotes
The THYSSENKRUPP AG O.N. rating is 3.080 EUR. The price registered a decrease of -0.23% on the session with the lowest point at 3.067 EUR and the highest point at 3.154 EUR. The deviation from the price is +0.42% for the low point and -2.35% for the high point.The Central Gaps scanner detects a bullish opening marking the presence of buyers ahead of sellers at the opening but not sufficiently marked to allow the price to register a quotation gap.
Bullish opening
Type : Bullish
Timeframe : Openning
A study of price movements over other periods shows the following variations:
New LOW record (5 years)
Type : Bearish
Timeframe : Weekly
New LOW record (1 year)
Type : Bearish
Timeframe : Weekly
New LOW record (1st january)
Type : Bearish
Timeframe : Weekly
New LOW record (1 month)
Type : Bearish
Timeframe : Weekly
Technical
Technical analysis of this 1H chart of THYSSENKRUPP AG O.N. indicates that the overall trend is strongly bearish. 92.86% of the signals given by moving averages are bearish. The overall trend is supported by the strong bearish signals from short-term moving averages. There is no crossing of moving average by the price or crossing of moving averages between themselves.
On the 18 technical indicators analysed, 4 are bullish, 4 are neutral and 10 are bearish. Caution: the Central Indicators scanner currently detects an excess:
CCI indicator is oversold : under -100
Type : Neutral
Timeframe : 1 hour
CCI indicator: bullish divergence
Type : Bullish
Timeframe : 1 hour
Williams %R indicator is oversold : under -80
Type : Neutral
Timeframe : 1 hour
Pivot points : price is under support 3
Type : Neutral
Timeframe : Weekly
Central Patterns, the market scanner focusing on chart patterns, resistances and supports found this result:
Near support of channel
Type : Bullish
Timeframe : 1 hour
No result was found by the Central Candlesticks scanner on Japanese candlesticks.
| Price | R1 | R2 | R3 | |
|---|---|---|---|---|
| ProTrendLines | 3.080 | 3.228 | 3.451 | 3.869 |
| Change (%) | - | +4.81% | +12.05% | +25.62% |
| Change | - | +0.148 | +0.371 | +0.789 |
| Level | - | Minor | Major | Intermediate |
Attention could also be paid to pivot points to set price objectives:
| Pivot points | S3 | S2 | S1 | PP | R1 | R2 | R3 |
|---|---|---|---|---|---|---|---|
| Standard | 2.813 | 2.950 | 3.018 | 3.155 | 3.223 | 3.360 | 3.428 |
| Camarilla | 3.031 | 3.049 | 3.068 | 3.087 | 3.106 | 3.125 | 3.143 |
| Woodie | 2.780 | 2.933 | 2.985 | 3.138 | 3.190 | 3.343 | 3.395 |
| Fibonacci | 2.950 | 3.028 | 3.076 | 3.155 | 3.233 | 3.281 | 3.360 |
| Pivot points | S3 | S2 | S1 | PP | R1 | R2 | R3 |
|---|---|---|---|---|---|---|---|
| Standard | 2.963 | 3.096 | 3.235 | 3.368 | 3.507 | 3.640 | 3.779 |
| Camarilla | 3.300 | 3.325 | 3.350 | 3.375 | 3.400 | 3.425 | 3.450 |
| Woodie | 2.967 | 3.098 | 3.239 | 3.370 | 3.511 | 3.642 | 3.783 |
| Fibonacci | 3.096 | 3.200 | 3.264 | 3.368 | 3.472 | 3.536 | 3.640 |
| Pivot points | S3 | S2 | S1 | PP | R1 | R2 | R3 |
|---|---|---|---|---|---|---|---|
| Standard | 2.278 | 2.840 | 3.190 | 3.752 | 4.102 | 4.664 | 5.014 |
| Camarilla | 3.288 | 3.372 | 3.455 | 3.539 | 3.623 | 3.706 | 3.790 |
| Woodie | 2.171 | 2.787 | 3.083 | 3.699 | 3.995 | 4.611 | 4.907 |
| Fibonacci | 2.840 | 3.189 | 3.404 | 3.752 | 4.101 | 4.316 | 4.664 |
Numerical data
The following are the details of the technical indicators and moving averages that were collected to generate this technical analysis:
| RSI (14): | 30.30 | |
| MACD (12,26,9): | -0.0640 | |
| Directional Movement: | -24.875 | |
| AROON (14): | -92.857 | |
| DEMA (21): | 3.099 | |
| Parabolic SAR (0,02-0,02-0,2): | 3.150 | |
| Elder Ray (13): | -0.063 | |
| Super Trend (3,10): | 3.204 | |
| Zig ZAG (10): | 3.088 | |
| VORTEX (21): | 0.7100 | |
| Stochastique (14,3,5): | 6.01 | |
| TEMA (21): | 3.072 | |
| Williams %R (14): | -92.98 | |
| Chande Momentum Oscillator (20): | -0.074 | |
| Repulse (5,40,3): | -1.3730 | |
| ROCnROLL: | 2 | |
| TRIX (15,9): | -0.2550 | |
| Courbe Coppock: | 9.84 |
| MA7: | 3.286 | |
| MA20: | 3.488 | |
| MA50: | 3.872 | |
| MA100: | 4.340 | |
| MAexp7: | 3.112 | |
| MAexp20: | 3.180 | |
| MAexp50: | 3.271 | |
| MAexp100: | 3.368 | |
| Price / MA7: | -6.27% | |
| Price / MA20: | -11.70% | |
| Price / MA50: | -20.45% | |
| Price / MA100: | -29.03% | |
| Price / MAexp7: | -1.03% | |
| Price / MAexp20: | -3.14% | |
| Price / MAexp50: | -5.84% | |
| Price / MAexp100: | -8.55% |
News
The latest news and videos published on THYSSENKRUPP AG O.N. at the time of the analysis were as follows:
- EQS-Adhoc: thyssenkrupp AG: thyssenkrupp AG adjusts outlook for FY 2023/24
- EQS-Adhoc: thyssenkrupp AG: thyssenkrupp and EP Corporate Group enter into strategic partnership
- BWI Group and thyssenkrupp Steering partner in EMB to lead world's chassis-by-wire technology
- TCC Joins Hands with Germany's thyssenkrupp Polysius to Develop Innovative Carbon Capture Technology with Separate Oxyfuel Calciner
-
 Look Ahead 22/11/23: Euro zone consumer confidence; US durable goods; Britvic; Sage; ThyssenKrupp
About author
Online


Add a comment
Comments
0 comments on the analysis THYSSENKRUPP AG O.N. - 1H