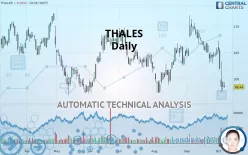
THALES - Daily - Technical analysis published on 10/07/2019 (GMT)
- 391
- 0
- Who voted?
Click here for a new analysis!
- Timeframe : Daily
- - Analysis generated on
- Status : TARGET REACHED

Summary of the analysis

Additional analysis
Quotes
THALES rating 98.44 EUR. On the day, this instrument lost -0.02% with the lowest point at 98.24 EUR and the highest point at 99.34 EUR. The deviation from the price is +0.20% for the low point and -0.91% for the high point.A bullish opening was detected by the Central Gaps scanner. Buyers are trying to impose a bullish momentum in the very short term.
Bullish opening
Type : Bullish
Timeframe : Openning
A study of price movements over other periods shows the following variations:
Near a new LOW record (1 month)
Type : Bearish
Timeframe : Weekly
Technical
A technical analysis in Daily of this THALES chart shows a bearish trend. 78.57% of the signals given by moving averages are bearish. This bearish trend is supported by the strong bearish signals given by short-term moving averages. An assessment of moving averages reveals a bearish signal that could impact this trend:
Moving Average bearish crossovers : AMA20 & AMA50
Type : Bearish
Timeframe : Daily
The probability of a further decline is moderate given the direction of the technical indicators.
Caution: the Central Indicators scanner currently detects an excess:
RSI indicator is oversold : under 30
Type : Neutral
Timeframe : Daily
CCI indicator is oversold : under -100
Type : Neutral
Timeframe : Daily
Previous candle closed under Bollinger bands
Type : Neutral
Timeframe : Daily
Williams %R indicator is oversold : under -80
Type : Neutral
Timeframe : Daily
Price is back under the pivot point
Type : Bearish
Timeframe : Daily
Price is back under the pivot point
Type : Bearish
Timeframe : Weekly
The Central Patterns scanner, which studies chart patterns, resistances and supports, has identified these signals:
Horizontal resistance is broken
Type : Bullish
Timeframe : Daily
Support of channel is broken
Type : Bearish
Timeframe : Daily
No result was found by the Central Candlesticks scanner on Japanese candlesticks.
| S3 | S2 | S1 | Price | R1 | R2 | R3 | |
|---|---|---|---|---|---|---|---|
| ProTrendLines | 84.00 | 96.05 | 97.36 | 98.44 | 98.72 | 104.53 | 108.99 |
| Change (%) | -14.67% | -2.43% | -1.10% | - | +0.28% | +6.19% | +10.72% |
| Change | -14.44 | -2.39 | -1.08 | - | +0.28 | +6.09 | +10.55 |
| Level | Intermediate | Major | Major | - | Intermediate | Intermediate | Major |
Attention could also be paid to pivot points to set price objectives:
| Pivot points | S3 | S2 | S1 | PP | R1 | R2 | R3 |
|---|---|---|---|---|---|---|---|
| Standard | 95.87 | 96.81 | 97.63 | 98.57 | 99.39 | 100.33 | 101.15 |
| Camarilla | 97.98 | 98.14 | 98.30 | 98.46 | 98.62 | 98.78 | 98.94 |
| Woodie | 95.82 | 96.78 | 97.58 | 98.54 | 99.34 | 100.30 | 101.10 |
| Fibonacci | 96.81 | 97.48 | 97.89 | 98.57 | 99.24 | 99.65 | 100.33 |
| Pivot points | S3 | S2 | S1 | PP | R1 | R2 | R3 |
|---|---|---|---|---|---|---|---|
| Standard | 85.14 | 91.30 | 94.88 | 101.04 | 104.62 | 110.78 | 114.36 |
| Camarilla | 95.78 | 96.67 | 97.57 | 98.46 | 99.35 | 100.25 | 101.14 |
| Woodie | 83.85 | 90.66 | 93.59 | 100.40 | 103.33 | 110.14 | 113.07 |
| Fibonacci | 91.30 | 95.02 | 97.32 | 101.04 | 104.76 | 107.06 | 110.78 |
| Pivot points | S3 | S2 | S1 | PP | R1 | R2 | R3 |
|---|---|---|---|---|---|---|---|
| Standard | 92.35 | 97.60 | 101.55 | 106.80 | 110.75 | 116.00 | 119.95 |
| Camarilla | 102.97 | 103.81 | 104.66 | 105.50 | 106.34 | 107.19 | 108.03 |
| Woodie | 91.70 | 97.28 | 100.90 | 106.48 | 110.10 | 115.68 | 119.30 |
| Fibonacci | 97.60 | 101.11 | 103.29 | 106.80 | 110.31 | 112.49 | 116.00 |
Numerical data
The following is the status of technical indicators and moving averages registered at the time this technical analysis was created:
| RSI (14): | 29.84 | |
| MACD (12,26,9): | -1.4700 | |
| Directional Movement: | -18.67 | |
| AROON (14): | -14.28 | |
| DEMA (21): | 101.99 | |
| Parabolic SAR (0,02-0,02-0,2): | 106.44 | |
| Elder Ray (13): | -3.74 | |
| Super Trend (3,10): | 105.25 | |
| Zig ZAG (10): | 98.48 | |
| VORTEX (21): | 0.7200 | |
| Stochastique (14,3,5): | 10.15 | |
| TEMA (21): | 100.26 | |
| Williams %R (14): | -90.55 | |
| Chande Momentum Oscillator (20): | -8.32 | |
| Repulse (5,40,3): | -4.3700 | |
| ROCnROLL: | 2 | |
| TRIX (15,9): | -0.0600 | |
| Courbe Coppock: | 10.71 |
| MA7: | 101.83 | |
| MA20: | 104.59 | |
| MA50: | 103.91 | |
| MA100: | 103.85 | |
| MAexp7: | 100.97 | |
| MAexp20: | 103.43 | |
| MAexp50: | 104.15 | |
| MAexp100: | 104.13 | |
| Price / MA7: | -3.33% | |
| Price / MA20: | -5.88% | |
| Price / MA50: | -5.26% | |
| Price / MA100: | -5.21% | |
| Price / MAexp7: | -2.51% | |
| Price / MAexp20: | -4.82% | |
| Price / MAexp50: | -5.48% | |
| Price / MAexp100: | -5.46% |
News
Don"t forget to follow the news on THALES. At the time of publication of this analysis, the latest news was as follows:
- Beijing Daxing International Airport Relies on Thales and BEST to increase Safety, Capacity and Efficiency of Air Traffic Management
- Beijing Daxing International Airport Relies on Thales and BEST to increase Safety, Capacity and Efficiency of Air Traffic Management
- Beijing Daxing International Airport Relies on Thales and BEST to increase Safety, Capacity and Efficiency of Air Traffic Management
- Beijing Daxing International Airport Relies on Thales and BEST to increase Safety, Capacity and Efficiency of Air Traffic Management
- Thales study: U.S. retailers remain a top target for high-profile cyberattacks as they rapidly adopt digital transformation
About author

Online


Add a comment
Comments
0 comments on the analysis THALES - Daily