THALES - Daily - Technical analysis published on 02/05/2024 (GMT)
- 199
- 0
Click here for a new analysis!
- Timeframe : Daily
- - Analysis generated on
- Status : INVALID

Summary of the analysis

Additional analysis
Quotes
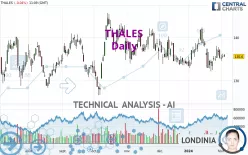
The THALES price is 135.60 EUR. On the day, this instrument lost -0.04% with the lowest point at 135.50 EUR and the highest point at 136.20 EUR. The deviation from the price is +0.07% for the low point and -0.44% for the high point.A bullish opening was detected by the Central Gaps scanner. Buyers are trying to impose a bullish momentum in the very short term.
Bullish opening
Type : Bullish
Timeframe : Openning
A study of price movements over other periods shows the following variations:
Near a new HIGH record (1st january)
Type : Bullish
Timeframe : Weekly
Near a new HIGH record (1 month)
Type : Bullish
Timeframe : Weekly
Technical
Technical analysis of THALES in Daily shows an overall bearish trend. 71.43% of the signals given by moving averages are bearish. The overall trend is reinforced by the strong bearish signals from short-term moving averages. The Central Indicators market scanner currently does not detect any result that concerns moving averages.
In fact, of the 18 technical indicators analysed by Central Analyzer, 5 are bullish, 7 are neutral and 6 are bearish. Central Indicators, the scanner specialised in technical indicators, has identified these signals:
RSI indicator is back over 50
Type : Bullish
Timeframe : Daily
Price is back under the pivot point
Type : Bearish
Timeframe : Daily
Williams %R indicator is back over -50
Type : Bullish
Timeframe : Daily
The Central Patterns scanner, which studies chart patterns, resistances and supports, has identified these signals:
Near resistance of channel
Type : Bearish
Timeframe : Daily
Near support of triangle
Type : Bullish
Timeframe : Daily
The Central Candlesticks scanner, specialised in Japanese candlesticks, did not identify any signals.
| S3 | S2 | S1 | Price | R1 | R2 | R3 | |
|---|---|---|---|---|---|---|---|
| ProTrendLines | 130.42 | 133.02 | 135.45 | 135.60 | 137.18 | 139.48 | 141.85 |
| Change (%) | -3.82% | -1.90% | -0.11% | - | +1.17% | +2.86% | +4.61% |
| Change | -5.18 | -2.58 | -0.15 | - | +1.58 | +3.88 | +6.25 |
| Level | Minor | Major | Minor | - | Intermediate | Major | Intermediate |
To determine price objectives, it is also possible to use the pivot points. Here is the price position in relation to pivot points:
| Pivot points | S3 | S2 | S1 | PP | R1 | R2 | R3 |
|---|---|---|---|---|---|---|---|
| Standard | 134.10 | 134.65 | 135.15 | 135.70 | 136.20 | 136.75 | 137.25 |
| Camarilla | 135.36 | 135.46 | 135.55 | 135.65 | 135.75 | 135.84 | 135.94 |
| Woodie | 134.08 | 134.64 | 135.13 | 135.69 | 136.18 | 136.74 | 137.23 |
| Fibonacci | 134.65 | 135.05 | 135.30 | 135.70 | 136.10 | 136.35 | 136.75 |
| Pivot points | S3 | S2 | S1 | PP | R1 | R2 | R3 |
|---|---|---|---|---|---|---|---|
| Standard | 130.78 | 132.72 | 134.18 | 136.12 | 137.58 | 139.52 | 140.98 |
| Camarilla | 134.72 | 135.03 | 135.34 | 135.65 | 135.96 | 136.27 | 136.59 |
| Woodie | 130.55 | 132.60 | 133.95 | 136.00 | 137.35 | 139.40 | 140.75 |
| Fibonacci | 132.72 | 134.02 | 134.82 | 136.12 | 137.42 | 138.22 | 139.52 |
| Pivot points | S3 | S2 | S1 | PP | R1 | R2 | R3 |
|---|---|---|---|---|---|---|---|
| Standard | 120.75 | 126.45 | 130.90 | 136.60 | 141.05 | 146.75 | 151.20 |
| Camarilla | 132.56 | 133.49 | 134.42 | 135.35 | 136.28 | 137.21 | 138.14 |
| Woodie | 120.13 | 126.14 | 130.28 | 136.29 | 140.43 | 146.44 | 150.58 |
| Fibonacci | 126.45 | 130.33 | 132.72 | 136.60 | 140.48 | 142.87 | 146.75 |
Numerical data
The following is the status of technical indicators and moving averages registered at the time this technical analysis was created:
| RSI (14): | 47.86 | |
| MACD (12,26,9): | -0.2600 | |
| Directional Movement: | 0.80 | |
| AROON (14): | -35.71 | |
| DEMA (21): | 135.64 | |
| Parabolic SAR (0,02-0,02-0,2): | 136.93 | |
| Elder Ray (13): | 0.05 | |
| Super Trend (3,10): | 141.02 | |
| Zig ZAG (10): | 135.55 | |
| VORTEX (21): | 0.9600 | |
| Stochastique (14,3,5): | 41.28 | |
| TEMA (21): | 135.50 | |
| Williams %R (14): | -51.77 | |
| Chande Momentum Oscillator (20): | -0.90 | |
| Repulse (5,40,3): | -0.9600 | |
| ROCnROLL: | 2 | |
| TRIX (15,9): | -0.0200 | |
| Courbe Coppock: | 3.42 |
| MA7: | 135.84 | |
| MA20: | 136.53 | |
| MA50: | 136.31 | |
| MA100: | 136.41 | |
| MAexp7: | 135.66 | |
| MAexp20: | 135.94 | |
| MAexp50: | 136.22 | |
| MAexp100: | 135.99 | |
| Price / MA7: | -0.18% | |
| Price / MA20: | -0.68% | |
| Price / MA50: | -0.52% | |
| Price / MA100: | -0.59% | |
| Price / MAexp7: | -0.04% | |
| Price / MAexp20: | -0.25% | |
| Price / MAexp50: | -0.46% | |
| Price / MAexp100: | -0.29% |
News
Don't forget to follow the news on THALES. At the time of publication of this analysis, the latest news was as follows:
- Paradise Mobile relies on Thales to deliver seamless connectivity in the Caribbean Region
- CompoSecure, IDEMIA, and Thales Named Market Leaders in ABI Research's Metal Payment Card Competitive Ranking
- CompoSecure, IDEMIA, and Thales Named Market Leaders in ABI Research's Metal Payment Card Competitive Ranking
- Thoma Bravo Completes Sale of Imperva to Thales
- Hitachi Rail secures clearance for EUR1,660m Thales GTS acquisition
About author
Online


Add a comment
Comments
0 comments on the analysis THALES - Daily