TEXAS INSTRUMENTS INC. - 1H - Technical analysis published on 07/05/2024 (GMT)
- 164
- 0
Click here for a new analysis!
- Timeframe : 1H
- - Analysis generated on
- Status : TARGET REACHED

Summary of the analysis

Additional analysis
Quotes
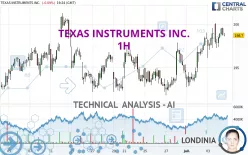
The TEXAS INSTRUMENTS INC. price is 198.73 USD. The price is lower by -0.08% since the last closing with the lowest point at 197.24 USD and the highest point at 200.15 USD. The deviation from the price is +0.76% for the low point and -0.71% for the high point.A bullish gap was detected at the opening by the Central Gaps scanner. There are a lot of buyers and they have the upper hand in the very short term.
Opening Gap UP
Type : Bullish
Timeframe : Openning
A study of price movements over other periods shows the following variations:
Near a new HIGH record (5 years)
Type : Bullish
Timeframe : Weekly
Near a new HIGH record (1 year)
Type : Bullish
Timeframe : Weekly
Near a new HIGH record (1st january)
Type : Bullish
Timeframe : Weekly
Near a new LOW record (1 month)
Type : Bearish
Timeframe : Weekly
Technical
Technical analysis of TEXAS INSTRUMENTS INC. in 1H shows a strongly overall bullish trend. The signals given by the moving averages are 92.86% bullish. This strong bullish trend is confirmed by the strong signals currently being given by short-term moving averages. The Central Indicators scanner does not detect any result on moving averages that would impact this trend.
The probability of a further increase are moderate given the direction of the technical indicators.
The Central Indicators scanner found this result concerning these indicators:
Pivot points : price is over resistance 1
Type : Neutral
Timeframe : Weekly
An analysis of the price chart with the Central Patterns scanner (detector of chart patterns and resistances and supports) shows a result that can have an impact on the price change:
Near support of channel
Type : Bullish
Timeframe : 1 hour
No result was found by the Central Candlesticks scanner on Japanese candlesticks.
| S3 | S2 | S1 | Price | R1 | R2 | R3 | |
|---|---|---|---|---|---|---|---|
| ProTrendLines | 193.11 | 194.95 | 196.79 | 198.73 | 199.05 | 201.29 | 202.54 |
| Change (%) | -2.83% | -1.90% | -0.98% | - | +0.16% | +1.29% | +1.92% |
| Change | -5.62 | -3.78 | -1.94 | - | +0.32 | +2.56 | +3.81 |
| Level | Major | Minor | Intermediate | - | Minor | Major | Major |
Pivot points can also be used to set your price objectives. Here is the price situation in relation to pivot points:
| Pivot points | S3 | S2 | S1 | PP | R1 | R2 | R3 |
|---|---|---|---|---|---|---|---|
| Standard | 193.31 | 194.70 | 196.79 | 198.18 | 200.27 | 201.66 | 203.75 |
| Camarilla | 197.92 | 198.24 | 198.56 | 198.88 | 199.20 | 199.52 | 199.84 |
| Woodie | 193.66 | 194.88 | 197.14 | 198.36 | 200.62 | 201.84 | 204.10 |
| Fibonacci | 194.70 | 196.03 | 196.85 | 198.18 | 199.51 | 200.33 | 201.66 |
| Pivot points | S3 | S2 | S1 | PP | R1 | R2 | R3 |
|---|---|---|---|---|---|---|---|
| Standard | 185.50 | 188.65 | 191.59 | 194.74 | 197.68 | 200.83 | 203.77 |
| Camarilla | 192.86 | 193.41 | 193.97 | 194.53 | 195.09 | 195.65 | 196.21 |
| Woodie | 185.40 | 188.60 | 191.49 | 194.69 | 197.58 | 200.78 | 203.67 |
| Fibonacci | 188.65 | 190.98 | 192.41 | 194.74 | 197.07 | 198.50 | 200.83 |
| Pivot points | S3 | S2 | S1 | PP | R1 | R2 | R3 |
|---|---|---|---|---|---|---|---|
| Standard | 180.80 | 186.25 | 190.39 | 195.84 | 199.98 | 205.43 | 209.57 |
| Camarilla | 191.89 | 192.77 | 193.65 | 194.53 | 195.41 | 196.29 | 197.17 |
| Woodie | 180.15 | 185.92 | 189.74 | 195.51 | 199.33 | 205.10 | 208.92 |
| Fibonacci | 186.25 | 189.91 | 192.18 | 195.84 | 199.50 | 201.77 | 205.43 |
Numerical data
The following is the status of technical indicators and moving averages registered at the time this technical analysis was created:
| RSI (14): | 62.38 | |
| MACD (12,26,9): | 1.0000 | |
| Directional Movement: | 18.86 | |
| AROON (14): | 35.71 | |
| DEMA (21): | 199.09 | |
| Parabolic SAR (0,02-0,02-0,2): | 197.98 | |
| Elder Ray (13): | 0.55 | |
| Super Trend (3,10): | 195.77 | |
| Zig ZAG (10): | 198.79 | |
| VORTEX (21): | 1.2200 | |
| Stochastique (14,3,5): | 71.69 | |
| TEMA (21): | 199.41 | |
| Williams %R (14): | -36.54 | |
| Chande Momentum Oscillator (20): | 0.22 | |
| Repulse (5,40,3): | -0.1600 | |
| ROCnROLL: | 1 | |
| TRIX (15,9): | 0.0800 | |
| Courbe Coppock: | 1.95 |
| MA7: | 195.94 | |
| MA20: | 195.79 | |
| MA50: | 191.36 | |
| MA100: | 179.07 | |
| MAexp7: | 198.66 | |
| MAexp20: | 197.79 | |
| MAexp50: | 196.42 | |
| MAexp100: | 195.80 | |
| Price / MA7: | +1.42% | |
| Price / MA20: | +1.50% | |
| Price / MA50: | +3.85% | |
| Price / MA100: | +10.98% | |
| Price / MAexp7: | +0.04% | |
| Price / MAexp20: | +0.48% | |
| Price / MAexp50: | +1.18% | |
| Price / MAexp100: | +1.50% |
News
The latest news and videos published on TEXAS INSTRUMENTS INC. at the time of the analysis were as follows:
- Texas Instruments and Delta Electronics announce collaboration to advance electric vehicle onboard charging
- TI unveils industry's first GaN IPM to enable smaller, more energy-efficient high-voltage motors
- TI Chief Financial Officer Rafael Lizardi to speak at Bank of America investor conference
- TI CEO Haviv Ilan to speak at Bernstein investor conference
- Texas Instruments board declares second quarter 2024 quarterly dividend
About author
Online


Add a comment
Comments
0 comments on the analysis TEXAS INSTRUMENTS INC. - 1H