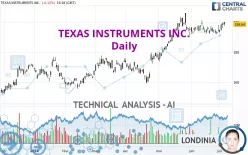
TEXAS INSTRUMENTS INC. - Daily - Technical analysis published on 07/05/2024 (GMT)
- 161
- 0
Click here for a new analysis!
- Timeframe : Daily
- - Analysis generated on
- Status : TARGET REACHED

Summary of the analysis

Additional analysis
Quotes
TEXAS INSTRUMENTS INC. rating 198.64 USD. The price registered a decrease of -0.12% on the session and was traded between 197.24 USD and 200.15 USD over the period. The price is currently at +0.71% from its lowest and -0.75% from its highest.A bullish gap was detected at the opening by the Central Gaps scanner. There are a lot of buyers and they have the upper hand in the very short term.
Opening Gap UP
Type : Bullish
Timeframe : Openning
So that you have an overall view of the price change, here is a table showing the variations over several periods:
Near a new HIGH record (5 years)
Type : Bullish
Timeframe : Weekly
Near a new HIGH record (1 year)
Type : Bullish
Timeframe : Weekly
Near a new HIGH record (1st january)
Type : Bullish
Timeframe : Weekly
Near a new LOW record (1 month)
Type : Bearish
Timeframe : Weekly
Technical
Technical analysis of TEXAS INSTRUMENTS INC. in Daily shows a strongly overall bullish trend. 92.86% of the signals given by moving averages are bullish. The overall trend is supported by the strong bullish signals from short-term moving averages. The Central Indicators market scanner currently does not detect any result that concerns moving averages.
In fact, 12 technical indicators on 18 studied are currently positioned bullish. But beware of excesses. The Central Indicators scanner currently detects this:
CCI indicator is overbought : over 100
Type : Neutral
Timeframe : Daily
Williams %R indicator is overbought : over -20
Type : Neutral
Timeframe : Daily
Pivot points : price is over resistance 1
Type : Neutral
Timeframe : Weekly
MACD crosses UP its Moving Average
Type : Bullish
Timeframe : Daily
Aroon indicator bullish trend
Type : Bullish
Timeframe : Daily
Ichimoku - Bullish crossover : Tenkan & Kijun
Type : Bullish
Timeframe : Daily
No signals are given by Central Patterns, a market scanner specialised in chart patterns, resistances and supports.
The Central Candlesticks scanner, specialised in Japanese candlesticks, did not identify any signals.
| S3 | S2 | S1 | Price | R1 | |
|---|---|---|---|---|---|
| ProTrendLines | 172.42 | 180.03 | 193.11 | 198.64 | 202.54 |
| Change (%) | -13.20% | -9.37% | -2.78% | - | +1.96% |
| Change | -26.22 | -18.61 | -5.53 | - | +3.90 |
| Level | Intermediate | Major | Major | - | Major |
Pivot points can also be used to set your price objectives. Here is the price situation in relation to pivot points:
| Pivot points | S3 | S2 | S1 | PP | R1 | R2 | R3 |
|---|---|---|---|---|---|---|---|
| Standard | 193.31 | 194.70 | 196.79 | 198.18 | 200.27 | 201.66 | 203.75 |
| Camarilla | 197.92 | 198.24 | 198.56 | 198.88 | 199.20 | 199.52 | 199.84 |
| Woodie | 193.66 | 194.88 | 197.14 | 198.36 | 200.62 | 201.84 | 204.10 |
| Fibonacci | 194.70 | 196.03 | 196.85 | 198.18 | 199.51 | 200.33 | 201.66 |
| Pivot points | S3 | S2 | S1 | PP | R1 | R2 | R3 |
|---|---|---|---|---|---|---|---|
| Standard | 185.50 | 188.65 | 191.59 | 194.74 | 197.68 | 200.83 | 203.77 |
| Camarilla | 192.86 | 193.41 | 193.97 | 194.53 | 195.09 | 195.65 | 196.21 |
| Woodie | 185.40 | 188.60 | 191.49 | 194.69 | 197.58 | 200.78 | 203.67 |
| Fibonacci | 188.65 | 190.98 | 192.41 | 194.74 | 197.07 | 198.50 | 200.83 |
| Pivot points | S3 | S2 | S1 | PP | R1 | R2 | R3 |
|---|---|---|---|---|---|---|---|
| Standard | 180.80 | 186.25 | 190.39 | 195.84 | 199.98 | 205.43 | 209.57 |
| Camarilla | 191.89 | 192.77 | 193.65 | 194.53 | 195.41 | 196.29 | 197.17 |
| Woodie | 180.15 | 185.92 | 189.74 | 195.51 | 199.33 | 205.10 | 208.92 |
| Fibonacci | 186.25 | 189.91 | 192.18 | 195.84 | 199.50 | 201.77 | 205.43 |
Numerical data
The following is the status of technical indicators and moving averages registered at the time this technical analysis was created:
| RSI (14): | 60.73 | |
| MACD (12,26,9): | 1.5100 | |
| Directional Movement: | 16.92 | |
| AROON (14): | 35.71 | |
| DEMA (21): | 197.71 | |
| Parabolic SAR (0,02-0,02-0,2): | 200.38 | |
| Elder Ray (13): | 2.60 | |
| Super Trend (3,10): | 190.70 | |
| Zig ZAG (10): | 198.69 | |
| VORTEX (21): | 1.0000 | |
| Stochastique (14,3,5): | 81.25 | |
| TEMA (21): | 196.27 | |
| Williams %R (14): | -16.65 | |
| Chande Momentum Oscillator (20): | 3.86 | |
| Repulse (5,40,3): | 1.3900 | |
| ROCnROLL: | 1 | |
| TRIX (15,9): | 0.1000 | |
| Courbe Coppock: | 0.04 |
| MA7: | 195.96 | |
| MA20: | 195.78 | |
| MA50: | 191.36 | |
| MA100: | 179.07 | |
| MAexp7: | 196.88 | |
| MAexp20: | 195.47 | |
| MAexp50: | 190.30 | |
| MAexp100: | 182.56 | |
| Price / MA7: | +1.37% | |
| Price / MA20: | +1.46% | |
| Price / MA50: | +3.80% | |
| Price / MA100: | +10.93% | |
| Price / MAexp7: | +0.89% | |
| Price / MAexp20: | +1.62% | |
| Price / MAexp50: | +4.38% | |
| Price / MAexp100: | +8.81% |
News
The last news published on TEXAS INSTRUMENTS INC. at the time of the generation of this analysis was as follows:
- Texas Instruments and Delta Electronics announce collaboration to advance electric vehicle onboard charging
- TI unveils industry's first GaN IPM to enable smaller, more energy-efficient high-voltage motors
- TI Chief Financial Officer Rafael Lizardi to speak at Bank of America investor conference
- TI CEO Haviv Ilan to speak at Bernstein investor conference
- Texas Instruments board declares second quarter 2024 quarterly dividend
About author
Online


Add a comment
Comments
0 comments on the analysis TEXAS INSTRUMENTS INC. - Daily