TESLA INC. - 1H - Technical analysis published on 12/23/2024 (GMT)
- 181
- 0
Click here for a new analysis!
- Timeframe : 1H
- - Analysis generated on
- Status : INVALID
Summary of the analysis

Additional analysis
Quotes
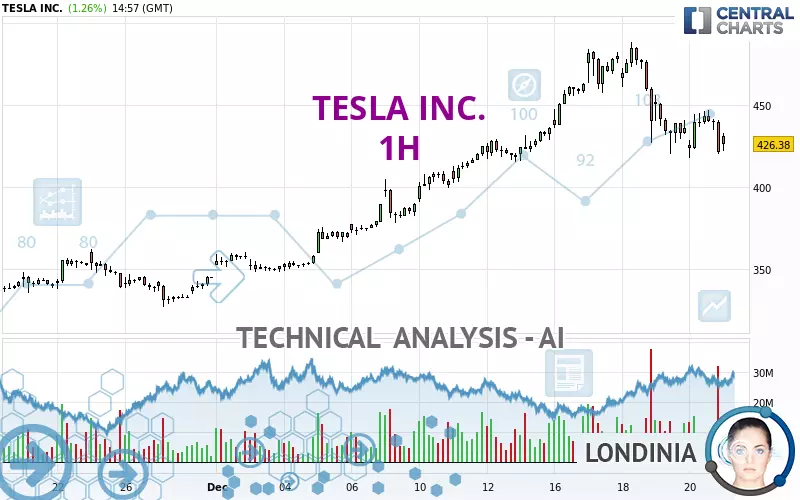
The TESLA INC. rating is 426.36 USD. The price has increased by +1.26% since the last closing and was between 422.07 USD and 432.80 USD. This implies that the price is at +1.02% from its lowest and at -1.49% from its highest.The Central Gaps scanner detects a bullish opening. A small advantage for buyers in the very short term.
Bullish opening
Type : Bullish
Timeframe : Openning
A study of price movements over other periods shows the following variations:
New HIGH record (5 years)
Type : Bullish
Timeframe : Weekly
Technical
A technical analysis in 1H of this TESLA INC. chart shows a slightly bullish trend. 57.14% of the signals given by moving averages are bullish. Caution: a reversal of the trend could be possible given the strong bearish signals of short-term moving averages. The Central Indicators market scanner is currently detecting several bearish signals that could impact this trend:
Bearish trend reversal : adaptative moving average 50
Type : Bearish
Timeframe : 1 hour
Moving Average bearish crossovers : MA20 & MA50
Type : Bearish
Timeframe : 1 hour
An assessment of technical indicators shows a bearish signal.
But beware of excesses. The Central Indicators scanner currently detects this:
RSI indicator: bullish divergence
Type : Bullish
Timeframe : 1 hour
Central Patterns, the market scanner focusing on chart patterns, resistances and supports found this result:
Near support of channel
Type : Bullish
Timeframe : 1 hour
The Central Candlesticks scanner which studies Japanese candlesticks did not detect anything.
| S3 | S2 | S1 | Price | R1 | R2 | |
|---|---|---|---|---|---|---|
| ProTrendLines | 352.56 | 377.76 | 409.97 | 426.36 | 461.11 | 488.54 |
| Change (%) | -17.31% | -11.40% | -3.84% | - | +8.15% | +14.58% |
| Change | -73.80 | -48.60 | -16.39 | - | +34.75 | +62.18 |
| Level | Major | Minor | Major | - | Minor | Major |
Pivot points can also be used to set your price objectives. Here is the price situation in relation to pivot points:
| Pivot points | S3 | S2 | S1 | PP | R1 | R2 | R3 |
|---|---|---|---|---|---|---|---|
| Standard | 380.67 | 399.15 | 410.11 | 428.59 | 439.55 | 458.03 | 468.99 |
| Camarilla | 412.96 | 415.66 | 418.36 | 421.06 | 423.76 | 426.46 | 429.16 |
| Woodie | 376.90 | 397.27 | 406.34 | 426.71 | 435.78 | 456.15 | 465.22 |
| Fibonacci | 399.15 | 410.40 | 417.35 | 428.59 | 439.84 | 446.79 | 458.03 |
| Pivot points | S3 | S2 | S1 | PP | R1 | R2 | R3 |
|---|---|---|---|---|---|---|---|
| Standard | 325.39 | 371.51 | 396.29 | 442.41 | 467.19 | 513.31 | 538.09 |
| Camarilla | 401.56 | 408.06 | 414.56 | 421.06 | 427.56 | 434.06 | 440.56 |
| Woodie | 314.71 | 366.18 | 385.61 | 437.08 | 456.51 | 507.98 | 527.41 |
| Fibonacci | 371.51 | 398.60 | 415.33 | 442.41 | 469.50 | 486.23 | 513.31 |
| Pivot points | S3 | S2 | S1 | PP | R1 | R2 | R3 |
|---|---|---|---|---|---|---|---|
| Standard | 145.67 | 192.27 | 268.72 | 315.32 | 391.77 | 438.37 | 514.82 |
| Camarilla | 311.32 | 322.60 | 333.88 | 345.16 | 356.44 | 367.72 | 379.00 |
| Woodie | 160.59 | 199.73 | 283.64 | 322.78 | 406.69 | 445.83 | 529.74 |
| Fibonacci | 192.27 | 239.28 | 268.32 | 315.32 | 362.33 | 391.37 | 438.37 |
Numerical data
The following is the status of technical indicators and moving averages registered at the time this technical analysis was created:
| RSI (14): | 38.08 | |
| MACD (12,26,9): | -5.1900 | |
| Directional Movement: | -17.56 | |
| AROON (14): | -57.14 | |
| DEMA (21): | 437.22 | |
| Parabolic SAR (0,02-0,02-0,2): | 447.08 | |
| Elder Ray (13): | -8.62 | |
| Super Trend (3,10): | 463.00 | |
| Zig ZAG (10): | 421.06 | |
| VORTEX (21): | 0.8000 | |
| Stochastique (14,3,5): | 32.31 | |
| TEMA (21): | 427.81 | |
| Williams %R (14): | -91.17 | |
| Chande Momentum Oscillator (20): | -20.33 | |
| Repulse (5,40,3): | -5.5100 | |
| ROCnROLL: | 2 | |
| TRIX (15,9): | -0.1100 | |
| Courbe Coppock: | 10.71 |
| MA7: | 442.08 | |
| MA20: | 392.14 | |
| MA50: | 320.57 | |
| MA100: | 272.93 | |
| MAexp7: | 434.86 | |
| MAexp20: | 442.39 | |
| MAexp50: | 438.16 | |
| MAexp100: | 416.32 | |
| Price / MA7: | -3.56% | |
| Price / MA20: | +8.73% | |
| Price / MA50: | +33.00% | |
| Price / MA100: | +56.22% | |
| Price / MAexp7: | -1.95% | |
| Price / MAexp20: | -3.62% | |
| Price / MAexp50: | -2.69% | |
| Price / MAexp100: | +2.41% |
News
The last news published on TESLA INC. at the time of the generation of this analysis was as follows:
-
 Chat GPT, US Dollar and Tesla headline a busy day of data
-
Elon Musk’s Tesla becomes newest $1 trillion company
- SHAREHOLDER ALERT: Pomerantz Law Firm Investigates Claims On Behalf of Investors of Tesla, Inc. - TSLA
-
BYD bests Tesla for the first time
-
Tesla i største stigning i 11 år, og vild vild uge vi går i møde!
About author

Online


Add a comment
Comments
0 comments on the analysis TESLA INC. - 1H