TESLA INC. - Daily - Technical analysis published on 12/18/2024 (GMT)
- 89
- 0
Click here for a new analysis!
- Timeframe : Daily
- - Analysis generated on
- Status : INVALID
Summary of the analysis

Additional analysis
Quotes
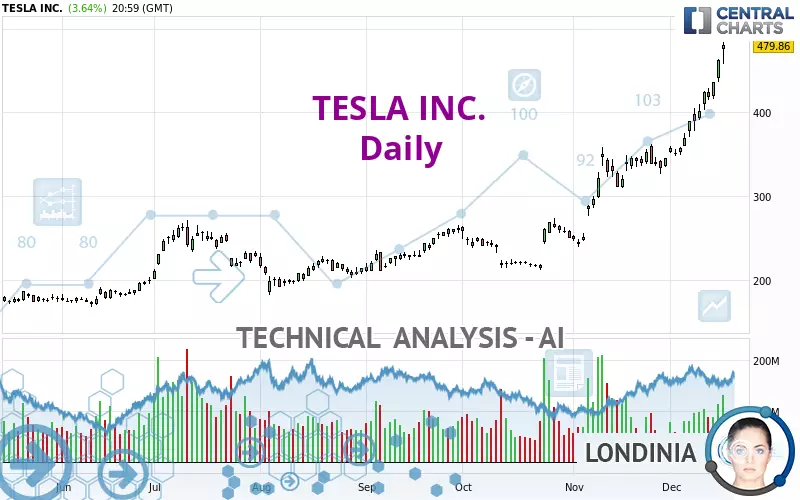
TESLA INC. rating 479.86 USD. The price has increased by +3.64% since the last closing and was between 457.51 USD and 483.99 USD. This implies that the price is at +4.89% from its lowest and at -0.85% from its highest.The Central Gaps scanner detects the formation of a bullish gap marking the strong presence of buyers against sellers at the opening. This formed a quotation gap.
Opening Gap UP
Type : Bullish
Timeframe : Openning
Here is a more detailed summary of the historical variations registered by TESLA INC.:
New HIGH record (5 years)
Type : Bullish
Timeframe : Weekly
New HIGH record (1 year)
Type : Bullish
Timeframe : Weekly
New HIGH record (1st january)
Type : Bullish
Timeframe : Weekly
New HIGH record (1 month)
Type : Bullish
Timeframe : Weekly
Technical
Technical analysis of this Daily chart of TESLA INC. indicates that the overall trend is strongly bullish. 92.86% of the signals given by moving averages are bullish. This strongly bullish trend is supported by the strong bullish signals given by short-term moving averages. The Central Indicators market scanner currently does not detect any result that concerns moving averages.
An assessment of technical indicators shows a strong bullish signal.
Caution: the Central Indicators scanner currently detects an excess:
RSI indicator is overbought : over 80
Type : Neutral
Timeframe : Daily
CCI indicator is overbought : over 100
Type : Neutral
Timeframe : Daily
Williams %R indicator is overbought : over -20
Type : Neutral
Timeframe : Daily
Pivot points : price is over resistance 1
Type : Neutral
Timeframe : Daily
Pivot points : price is over resistance 2
Type : Neutral
Timeframe : Weekly
The Central Patterns scanner, which studies chart patterns, resistances and supports, has identified this signal:
Resistance of channel is broken
Type : Bullish
Timeframe : Daily
The Central Candlesticks scanner, specialised in Japanese candlesticks, did not identify any signals.
| S3 | S2 | S1 | Price | |
|---|---|---|---|---|
| ProTrendLines | 293.54 | 352.56 | 409.97 | 479.86 |
| Change (%) | -38.83% | -26.53% | -14.56% | - |
| Change | -186.32 | -127.30 | -69.89 | - |
| Level | Major | Major | Major | - |
Pivot points can also be used to set your price objectives. Here is the price situation in relation to pivot points:
| Pivot points | S3 | S2 | S1 | PP | R1 | R2 | R3 |
|---|---|---|---|---|---|---|---|
| Standard | 437.10 | 447.31 | 463.58 | 473.79 | 490.06 | 500.27 | 516.54 |
| Camarilla | 472.58 | 475.01 | 477.43 | 479.86 | 482.29 | 484.72 | 487.14 |
| Woodie | 440.14 | 448.83 | 466.62 | 475.31 | 493.10 | 501.79 | 519.58 |
| Fibonacci | 447.31 | 457.42 | 463.67 | 473.79 | 483.90 | 490.15 | 500.27 |
| Pivot points | S3 | S2 | S1 | PP | R1 | R2 | R3 |
|---|---|---|---|---|---|---|---|
| Standard | 339.10 | 358.56 | 397.39 | 416.85 | 455.68 | 475.14 | 513.97 |
| Camarilla | 420.20 | 425.54 | 430.89 | 436.23 | 441.57 | 446.92 | 452.26 |
| Woodie | 348.80 | 363.40 | 407.09 | 421.69 | 465.38 | 479.98 | 523.67 |
| Fibonacci | 358.56 | 380.82 | 394.58 | 416.85 | 439.11 | 452.87 | 475.14 |
| Pivot points | S3 | S2 | S1 | PP | R1 | R2 | R3 |
|---|---|---|---|---|---|---|---|
| Standard | 145.67 | 192.27 | 268.72 | 315.32 | 391.77 | 438.37 | 514.82 |
| Camarilla | 311.32 | 322.60 | 333.88 | 345.16 | 356.44 | 367.72 | 379.00 |
| Woodie | 160.59 | 199.73 | 283.64 | 322.78 | 406.69 | 445.83 | 529.74 |
| Fibonacci | 192.27 | 239.28 | 268.32 | 315.32 | 362.33 | 391.37 | 438.37 |
Numerical data
The following is the status of technical indicators and moving averages registered at the time this technical analysis was created:
| RSI (14): | 83.68 | |
| MACD (12,26,9): | 40.5400 | |
| Directional Movement: | 46.31 | |
| AROON (14): | 92.86 | |
| DEMA (21): | 437.57 | |
| Parabolic SAR (0,02-0,02-0,2): | 392.92 | |
| Elder Ray (13): | 61.62 | |
| Super Trend (3,10): | 411.80 | |
| Zig ZAG (10): | 479.86 | |
| VORTEX (21): | 1.3300 | |
| Stochastique (14,3,5): | 99.06 | |
| TEMA (21): | 454.47 | |
| Williams %R (14): | -2.62 | |
| Chande Momentum Oscillator (20): | 134.70 | |
| Repulse (5,40,3): | 11.2200 | |
| ROCnROLL: | 1 | |
| TRIX (15,9): | 1.4500 | |
| Courbe Coppock: | 52.76 |
| MA7: | 430.39 | |
| MA20: | 378.65 | |
| MA50: | 309.11 | |
| MA100: | 266.82 | |
| MAexp7: | 435.36 | |
| MAexp20: | 387.28 | |
| MAexp50: | 331.38 | |
| MAexp100: | 288.68 | |
| Price / MA7: | +11.49% | |
| Price / MA20: | +26.73% | |
| Price / MA50: | +55.24% | |
| Price / MA100: | +79.84% | |
| Price / MAexp7: | +10.22% | |
| Price / MAexp20: | +23.91% | |
| Price / MAexp50: | +44.81% | |
| Price / MAexp100: | +66.23% |
News
Don't forget to follow the news on TESLA INC.. At the time of publication of this analysis, the latest news was as follows:
-
 Chat GPT, US Dollar and Tesla headline a busy day of data
-
Elon Musk’s Tesla becomes newest $1 trillion company
- SHAREHOLDER ALERT: Pomerantz Law Firm Investigates Claims On Behalf of Investors of Tesla, Inc. - TSLA
-
BYD bests Tesla for the first time
-
Tesla i største stigning i 11 år, og vild vild uge vi går i møde!
About author

Online


Add a comment
Comments
0 comments on the analysis TESLA INC. - Daily