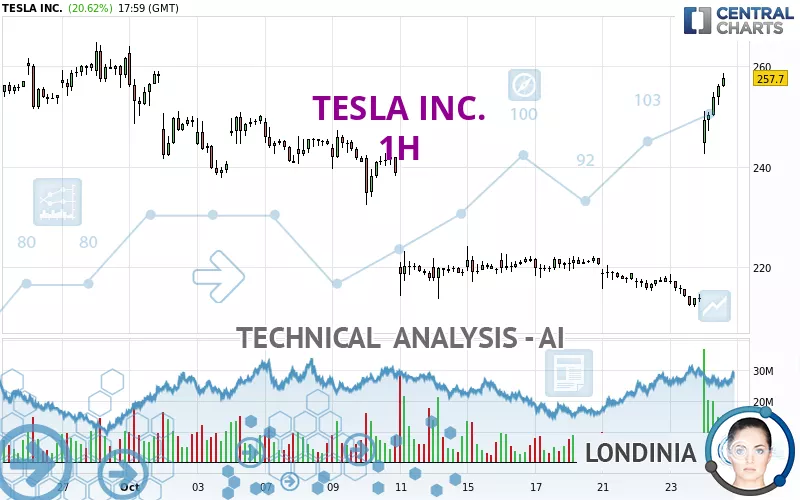
TESLA INC. - 1H - Technical analysis published on 10/24/2024 (GMT)
- 121
- 0
Click here for a new analysis!
- Timeframe : 1H
- - Analysis generated on
- Status : TARGET REACHED

Summary of the analysis

Additional analysis
Quotes
The TESLA INC. price is 257.70 USD. The price registered an increase of +20.62% on the session and was traded between 242.65 USD and 258.69 USD over the period. The price is currently at +6.20% from its lowest and -0.38% from its highest.The Central Gaps scanner detects a bullish gap which is a sign that buyers have taken the lead in the very short term.
Opening Gap UP
Type : Bullish
Timeframe : Openning
A study of price movements over other periods shows the following variations:
Near a new HIGH record (1 month)
Type : Bullish
Timeframe : Weekly
Technical
Technical analysis of this 1H chart of TESLA INC. indicates that the overall trend is strongly bullish. 82.14% of the signals given by moving averages are bullish. The overall trend is supported by the strong bullish signals from short-term moving averages. There is no crossing of moving average by the price or crossing of moving averages between themselves.
In fact, according to the parameters integrated into the Central Analyzer system, 16 technical indicators out of 18 analysed are currently bullish. But beware of excesses. The Central Indicators scanner currently detects this:
RSI indicator is overbought : over 80
Type : Neutral
Timeframe : 1 hour
CCI indicator is overbought : over 100
Type : Neutral
Timeframe : 1 hour
Williams %R indicator is overbought : over -20
Type : Neutral
Timeframe : 1 hour
Pivot points : price is over resistance 3
Type : Neutral
Timeframe : 1 hour
Pivot points : price is over resistance 3
Type : Neutral
Timeframe : Weekly
Central Patterns, the market scanner focusing on chart patterns, resistances and supports found this result:
Resistance of channel is broken
Type : Bullish
Timeframe : 1 hour
The Central Candlesticks scanner which studies Japanese candlesticks did not detect anything.
| S3 | S2 | S1 | Price | R1 | R2 | R3 | |
|---|---|---|---|---|---|---|---|
| ProTrendLines | 222.22 | 240.85 | 251.24 | 257.70 | 262.65 | 293.54 | 381.82 |
| Change (%) | -13.77% | -6.54% | -2.51% | - | +1.92% | +13.91% | +48.16% |
| Change | -35.48 | -16.85 | -6.46 | - | +4.95 | +35.84 | +124.12 |
| Level | Intermediate | Intermediate | Intermediate | - | Major | Intermediate | Minor |
Attention could also be paid to pivot points to set price objectives:
| Pivot points | S3 | S2 | S1 | PP | R1 | R2 | R3 |
|---|---|---|---|---|---|---|---|
| Standard | 204.32 | 208.22 | 210.93 | 214.83 | 217.54 | 221.44 | 224.15 |
| Camarilla | 211.83 | 212.44 | 213.04 | 213.65 | 214.26 | 214.86 | 215.47 |
| Woodie | 203.74 | 207.92 | 210.35 | 214.53 | 216.96 | 221.14 | 223.57 |
| Fibonacci | 208.22 | 210.74 | 212.30 | 214.83 | 217.35 | 218.91 | 221.44 |
| Pivot points | S3 | S2 | S1 | PP | R1 | R2 | R3 |
|---|---|---|---|---|---|---|---|
| Standard | 204.35 | 209.05 | 214.87 | 219.57 | 225.39 | 230.09 | 235.91 |
| Camarilla | 217.81 | 218.77 | 219.74 | 220.70 | 221.66 | 222.63 | 223.59 |
| Woodie | 204.92 | 209.33 | 215.44 | 219.85 | 225.96 | 230.37 | 236.48 |
| Fibonacci | 209.05 | 213.07 | 215.55 | 219.57 | 223.59 | 226.07 | 230.09 |
| Pivot points | S3 | S2 | S1 | PP | R1 | R2 | R3 |
|---|---|---|---|---|---|---|---|
| Standard | 170.67 | 190.16 | 225.89 | 245.38 | 281.11 | 300.60 | 336.33 |
| Camarilla | 246.45 | 251.51 | 256.57 | 261.63 | 266.69 | 271.75 | 276.82 |
| Woodie | 178.80 | 194.22 | 234.02 | 249.44 | 289.24 | 304.66 | 344.46 |
| Fibonacci | 190.16 | 211.25 | 224.28 | 245.38 | 266.47 | 279.50 | 300.60 |
Numerical data
The following are the details of the technical indicators and moving averages that were collected to generate this technical analysis:
| RSI (14): | 87.26 | |
| MACD (12,26,9): | 8.5900 | |
| Directional Movement: | 53.28 | |
| AROON (14): | 42.86 | |
| DEMA (21): | 240.14 | |
| Parabolic SAR (0,02-0,02-0,2): | 217.78 | |
| Elder Ray (13): | 20.87 | |
| Super Trend (3,10): | 242.84 | |
| Zig ZAG (10): | 258.23 | |
| VORTEX (21): | 1.1000 | |
| Stochastique (14,3,5): | 98.70 | |
| TEMA (21): | 248.54 | |
| Williams %R (14): | -0.88 | |
| Chande Momentum Oscillator (20): | 40.32 | |
| Repulse (5,40,3): | 3.5200 | |
| ROCnROLL: | 1 | |
| TRIX (15,9): | 0.2100 | |
| Courbe Coppock: | 23.88 |
| MA7: | 224.54 | |
| MA20: | 235.64 | |
| MA50: | 229.42 | |
| MA100: | 220.72 | |
| MAexp7: | 245.35 | |
| MAexp20: | 231.23 | |
| MAexp50: | 226.17 | |
| MAexp100: | 228.37 | |
| Price / MA7: | +14.77% | |
| Price / MA20: | +9.36% | |
| Price / MA50: | +12.33% | |
| Price / MA100: | +16.75% | |
| Price / MAexp7: | +5.05% | |
| Price / MAexp20: | +11.46% | |
| Price / MAexp50: | +13.95% | |
| Price / MAexp100: | +12.86% |
News
Don't forget to follow the news on TESLA INC.. At the time of publication of this analysis, the latest news was as follows:
-
 TESLA Takes On The Competition. Reports earnings October 23. #tesla #tsla #earningsreport
-
Tesla faces probe after fatal ‘Full Self Driving’ collisions
- SHAREHOLDER ALERT: Pomerantz Law Firm Investigates Claims On Behalf of Investors of Tesla, Inc. - TSLA
-
Tesla stock down after Musk unveils its new robotaxi #shorts
-
Why Elon Musk’s Robotaxi Is Such a Risky Bet for Tesla
About author

Online


Add a comment
Comments
0 comments on the analysis TESLA INC. - 1H