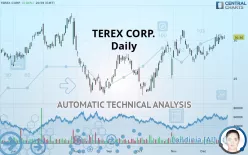
TEREX CORP. - Daily - Technical analysis published on 12/23/2019 (GMT)
- 305
- 0
- Who voted?
Click here for a new analysis!
- Timeframe : Daily
- - Analysis generated on
- Status : INVALID

Summary of the analysis

Additional analysis
Quotes
The TEREX CORP. price is 30.36 USD. The price has increased by +0.86% since the last closing and was between 30.12 USD and 30.65 USD. This implies that the price is at +0.80% from its lowest and at -0.95% from its highest.The Central Gaps scanner detects a bullish opening. A small advantage for buyers in the very short term.
Bullish opening
Type : Bullish
Timeframe : Openning
A study of price movements over other periods shows the following variations:
Near a new HIGH record (1 month)
Type : Bullish
Timeframe : Weekly
Technical
Technical analysis of TEREX CORP. in Daily shows a strongly overall bullish trend. The signals given by the moving averages are 92.86% bullish. This strong bullish trend is confirmed by the strong signals currently being given by short-term moving averages. There is no crossing of moving average by the price or crossing of moving averages between themselves.
In fact, 15 technical indicators on 18 studied are currently bullish. Caution: the Central Indicators scanner currently detects an excess:
CCI indicator is overbought : over 100
Type : Neutral
Timeframe : Daily
CCI indicator: bearish divergence
Type : Bearish
Timeframe : Daily
RSI indicator: bearish divergence
Type : Bearish
Timeframe : Daily
Williams %R indicator is overbought : over -20
Type : Neutral
Timeframe : Daily
Price is back over the pivot point
Type : Bullish
Timeframe : Weekly
Price is back under the pivot point
Type : Bearish
Timeframe : Daily
The analysis of the price chart with Central Patterns scanners does not return any result.
The Central Candlesticks scanner which studies Japanese candlesticks did not detect anything.
| S3 | S2 | S1 | Price | R1 | R2 | R3 | |
|---|---|---|---|---|---|---|---|
| ProTrendLines | 25.90 | 27.92 | 29.57 | 30.36 | 31.32 | 33.14 | 34.02 |
| Change (%) | -14.69% | -8.04% | -2.60% | - | +3.16% | +9.16% | +12.06% |
| Change | -4.46 | -2.44 | -0.79 | - | +0.96 | +2.78 | +3.66 |
| Level | Major | Major | Major | - | Major | Minor | Minor |
To determine price objectives, it is also possible to use the pivot points. Here is the price position in relation to pivot points:
| Pivot points | S3 | S2 | S1 | PP | R1 | R2 | R3 |
|---|---|---|---|---|---|---|---|
| Standard | 29.51 | 29.77 | 29.94 | 30.20 | 30.37 | 30.63 | 30.80 |
| Camarilla | 29.98 | 30.02 | 30.06 | 30.10 | 30.14 | 30.18 | 30.22 |
| Woodie | 29.46 | 29.75 | 29.89 | 30.18 | 30.32 | 30.61 | 30.75 |
| Fibonacci | 29.77 | 29.94 | 30.04 | 30.20 | 30.37 | 30.47 | 30.63 |
| Pivot points | S3 | S2 | S1 | PP | R1 | R2 | R3 |
|---|---|---|---|---|---|---|---|
| Standard | 26.51 | 27.53 | 28.70 | 29.73 | 30.90 | 31.92 | 33.09 |
| Camarilla | 29.27 | 29.47 | 29.67 | 29.87 | 30.07 | 30.27 | 30.47 |
| Woodie | 26.58 | 27.57 | 28.77 | 29.76 | 30.97 | 31.96 | 33.16 |
| Fibonacci | 27.53 | 28.37 | 28.89 | 29.73 | 30.56 | 31.08 | 31.92 |
| Pivot points | S3 | S2 | S1 | PP | R1 | R2 | R3 |
|---|---|---|---|---|---|---|---|
| Standard | 22.22 | 24.67 | 26.38 | 28.83 | 30.53 | 32.98 | 34.69 |
| Camarilla | 26.94 | 27.32 | 27.70 | 28.08 | 28.46 | 28.84 | 29.22 |
| Woodie | 21.85 | 24.49 | 26.00 | 28.64 | 30.16 | 32.80 | 34.31 |
| Fibonacci | 24.67 | 26.26 | 27.24 | 28.83 | 30.42 | 31.40 | 32.98 |
Numerical data
The following is the status of technical indicators and moving averages registered at the time this technical analysis was created:
| RSI (14): | 60.15 | |
| MACD (12,26,9): | 0.5500 | |
| Directional Movement: | 14.40 | |
| AROON (14): | 57.15 | |
| DEMA (21): | 30.04 | |
| Parabolic SAR (0,02-0,02-0,2): | 28.31 | |
| Elder Ray (13): | 0.73 | |
| Super Trend (3,10): | 28.04 | |
| Zig ZAG (10): | 30.36 | |
| VORTEX (21): | 1.1300 | |
| Stochastique (14,3,5): | 87.38 | |
| TEMA (21): | 30.21 | |
| Williams %R (14): | -11.54 | |
| Chande Momentum Oscillator (20): | 2.33 | |
| Repulse (5,40,3): | -0.7200 | |
| ROCnROLL: | 1 | |
| TRIX (15,9): | 0.2000 | |
| Courbe Coppock: | 12.93 |
| MA7: | 30.13 | |
| MA20: | 29.10 | |
| MA50: | 28.48 | |
| MA100: | 26.94 | |
| MAexp7: | 30.02 | |
| MAexp20: | 29.36 | |
| MAexp50: | 28.53 | |
| MAexp100: | 28.14 | |
| Price / MA7: | +0.76% | |
| Price / MA20: | +4.33% | |
| Price / MA50: | +6.60% | |
| Price / MA100: | +12.69% | |
| Price / MAexp7: | +1.13% | |
| Price / MAexp20: | +3.41% | |
| Price / MAexp50: | +6.41% | |
| Price / MAexp100: | +7.89% |
News
The last news published on TEREX CORP. at the time of the generation of this analysis was as follows:
- Terex Inks Agreement on Phase III Capital Expansion Project with Changzhou National Hi-Tech District
- SHAREHOLDER ALERT: Purcell Julie & Lefkowitz LLP Is Investigating Terex Corporation for Potential Breaches Of Fiduciary Duty By Its Board of Directors
- GFS Corp Announces the Development of a New Liquid Natural Gas Mine Haul Truck Conversion System for the Terex Unit Rig 4400 Model Haul Truck
-
 Terex
Terex
About author

Online


Add a comment
Comments
0 comments on the analysis TEREX CORP. - Daily