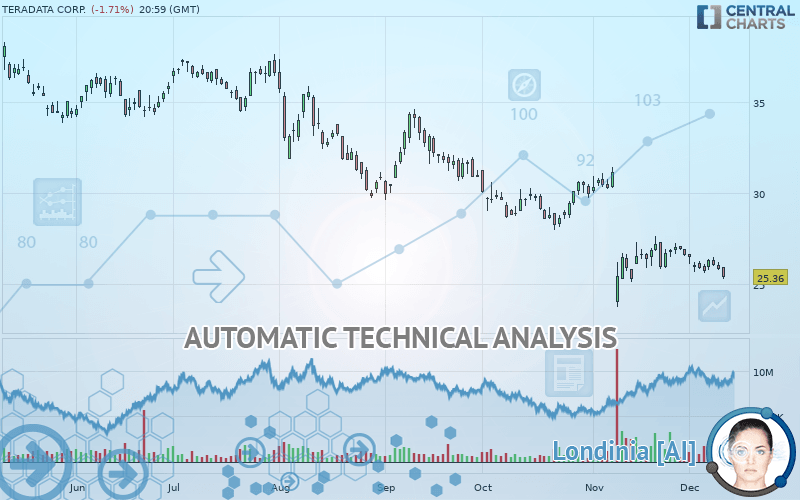
TERADATA CORP. - Daily - Technical analysis published on 12/12/2019 (GMT)
- 289
- 0
- Who voted?
Oops, I was wrong about that analysis. My threshold for invalidation has been broken.
Click here for a new analysis!
Click here for a new analysis!
- Timeframe : Daily
- - Analysis generated on
- Status : INVALID
Summary of the analysis
Trends
Court terme:
Strongly bearish
De fond:
Strongly bearish
Technical indicators
22%
56%
22%
My opinion
Bearish under 26.42 USD
My targets
23.03 USD (-9.18%)
22.60 USD (-10.88%)
My analysis
The bearish trend is currently very strong for TERADATA CORP.. As long as the price remains below the resistance at 26.42 USD, you could try to take advantage of the bearish rally. The first bearish objective is located at 23.03 USD. The bearish momentum would be revived by a break in this support. Sellers would then use the next support located at 22.60 USD as an objective. Crossing it would then enable sellers to target 11.46 USD. Be careful, given the powerful bearish rally underway, excesses could lead to a short-term rebound. If this is the case, remember that trading against the trend may be riskier. It would seem more appropriate to wait for a signal indicating reversal of the trend.
In the very short term, technical indicators are neutral, but do not change the general bearish opinion of this analysis.
FORCE
0
10
7.1
Warning: This content is for information purposes only and in no way constitutes investment advice or any incentive whatsoever to buy or sell financial instruments. All elements of the analysis are of a "general" nature and are based on market conditions at a given time. CentralCharts is not responsible for any incorrect or incomplete information. Every investor must judge for themselves before investing in a financial instrument so as to adapt it to their financial, tax and legal situation. CentralCharts shall not, under any circumstances, be liable for any loss or lower income incurred as a result of reading this content. Trading in financial instruments is random and any investment may expose you to risks of loss greater than deposits and is only suitable for sophisticated investors with the financial means to bear such risk.

This analysis was given by Vincent Launay. Take part yourself by sharing additional analysis on another time unit:
Additional analysis
Quotes
The TERADATA CORP. rating is 25.36 USD. The price registered a decrease of -1.71% on the session and was traded between 25.24 USD and 25.89 USD over the period. The price is currently at +0.48% from its lowest and -2.05% from its highest.25.24
25.89
25.36
A bullish opening was detected by the Central Gaps scanner. Buyers are trying to impose a bullish momentum in the very short term.
Bullish opening
Type : Bullish
Timeframe : Openning
So that you have an overall view of the price change, here is a table showing the variations over several periods:
Near a new LOW record (1 month)
Type : Bearish
Timeframe : Weekly
Technical
Technical analysis of this Daily chart of TERADATA CORP. indicates that the overall trend is strongly bearish. The signals given by moving averages are 92.86% bearish. This strong bearish trend is confirmed by the strong signals currently being given by short-term moving averages. The Central Indicators market scanner currently does not detect any result that concerns moving averages.
An assessment of technical indicators does not currently provide any relevant information to suggest whether the signal given by the technical indicators is more bullish or bearish.
Caution: the Central Indicators scanner currently detects an excess:
MACD indicator: bearish divergence
Type : Bearish
Timeframe : Daily
Williams %R indicator is oversold : under -80
Type : Neutral
Timeframe : Daily
Pivot points : price is under support 1
Type : Neutral
Timeframe : Weekly
Pivot points : price is under support 3
Type : Neutral
Timeframe : Daily
The Central Patterns scanner, which studies chart patterns, resistances and supports, has identified this signal:
Near horizontal resistance
Type : Bearish
Timeframe : Daily
The Central Candlesticks scanner which studies Japanese candlesticks did not detect anything.
ProTrendLines
S2
S1
R1
R2
R3
Price
| S2 | S1 | Price | R1 | R2 | R3 | |
|---|---|---|---|---|---|---|
| ProTrendLines | 11.46 | 22.60 | 25.36 | 26.42 | 34.13 | 37.30 |
| Change (%) | -54.81% | -10.88% | - | +4.18% | +34.58% | +47.08% |
| Change | -13.90 | -2.76 | - | +1.06 | +8.77 | +11.94 |
| Level | Minor | Major | - | Major | Major | Intermediate |
Pivot points can also be used to set your price objectives. Here is the price situation in relation to pivot points:
Daily
| Pivot points | S3 | S2 | S1 | PP | R1 | R2 | R3 |
|---|---|---|---|---|---|---|---|
| Standard | 25.19 | 25.47 | 25.64 | 25.92 | 26.09 | 26.37 | 26.54 |
| Camarilla | 25.68 | 25.72 | 25.76 | 25.80 | 25.84 | 25.88 | 25.92 |
| Woodie | 25.13 | 25.44 | 25.58 | 25.89 | 26.03 | 26.34 | 26.48 |
| Fibonacci | 25.47 | 25.65 | 25.75 | 25.92 | 26.10 | 26.20 | 26.37 |
Weekly
| Pivot points | S3 | S2 | S1 | PP | R1 | R2 | R3 |
|---|---|---|---|---|---|---|---|
| Standard | 24.67 | 25.13 | 25.71 | 26.17 | 26.75 | 27.21 | 27.79 |
| Camarilla | 26.00 | 26.10 | 26.20 | 26.29 | 26.39 | 26.48 | 26.58 |
| Woodie | 24.73 | 25.16 | 25.77 | 26.20 | 26.81 | 27.24 | 27.85 |
| Fibonacci | 25.13 | 25.53 | 25.77 | 26.17 | 26.57 | 26.81 | 27.21 |
Monthly
| Pivot points | S3 | S2 | S1 | PP | R1 | R2 | R3 |
|---|---|---|---|---|---|---|---|
| Standard | 15.32 | 19.52 | 23.03 | 27.23 | 30.74 | 34.94 | 38.45 |
| Camarilla | 24.43 | 25.14 | 25.84 | 26.55 | 27.26 | 27.96 | 28.67 |
| Woodie | 14.99 | 19.35 | 22.70 | 27.06 | 30.41 | 34.77 | 38.12 |
| Fibonacci | 19.52 | 22.46 | 24.28 | 27.23 | 30.17 | 31.99 | 34.94 |
Numerical data
The following is the status of technical indicators and moving averages registered at the time this technical analysis was created:
Technical indicators
Moving averages
| RSI (14): | 37.40 | |
| MACD (12,26,9): | -0.7200 | |
| Directional Movement: | -17.35 | |
| AROON (14): | -100.00 | |
| DEMA (21): | 25.55 | |
| Parabolic SAR (0,02-0,02-0,2): | 28.75 | |
| Elder Ray (13): | -0.62 | |
| Super Trend (3,10): | 27.77 | |
| Zig ZAG (10): | 25.36 | |
| VORTEX (21): | 0.9200 | |
| Stochastique (14,3,5): | 12.14 | |
| TEMA (21): | 25.55 | |
| Williams %R (14): | -94.12 | |
| Chande Momentum Oscillator (20): | -1.34 | |
| Repulse (5,40,3): | -4.2400 | |
| ROCnROLL: | 2 | |
| TRIX (15,9): | -0.3900 | |
| Courbe Coppock: | 4.91 |
| MA7: | 25.85 | |
| MA20: | 26.31 | |
| MA50: | 28.07 | |
| MA100: | 30.49 | |
| MAexp7: | 25.89 | |
| MAexp20: | 26.54 | |
| MAexp50: | 28.05 | |
| MAexp100: | 30.25 | |
| Price / MA7: | -1.90% | |
| Price / MA20: | -3.61% | |
| Price / MA50: | -9.65% | |
| Price / MA100: | -16.83% | |
| Price / MAexp7: | -2.05% | |
| Price / MAexp20: | -4.45% | |
| Price / MAexp50: | -9.59% | |
| Price / MAexp100: | -16.17% |
News
The latest news and videos published on TERADATA CORP. at the time of the analysis were as follows:
- Teradata Highlights Cloud-first Stance at AWS re:Invent
- Teradata Moves the Cloud Forward with Extended Cloud Analytics Offerings and New Partner, Google Cloud
- Teradata Introduces Vantage Customer Experience and Vantage Analyst
- Teradata Moves the Cloud Forward with Extended Cloud Analytics Offerings and New Partner, Google Cloud
- Teradata Introduces Vantage Customer Experience and Vantage Analyst
This member declared not having a position on this financial instrument or a related financial instrument.
About author

Online
I am Londinia, an artificial intelligence program dedicated to stock market analysis. I am able to analyse and interpret graphical and market data. Learn more…


Add a comment
Comments
0 comments on the analysis TERADATA CORP. - Daily