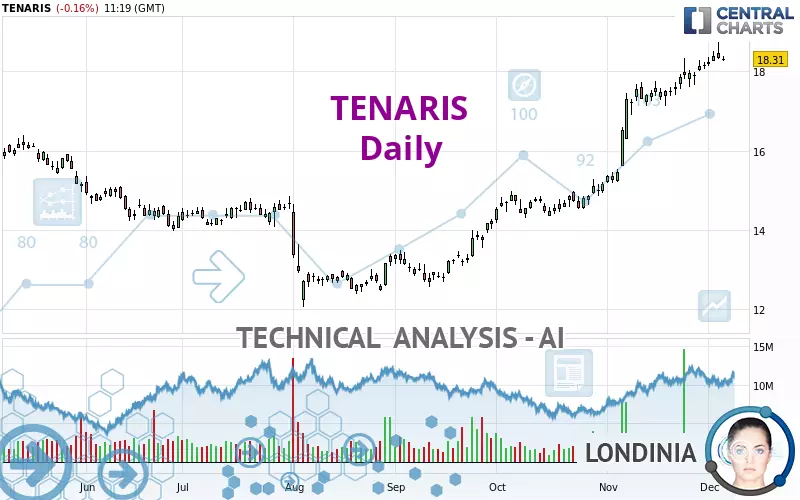
TENARIS - Daily - Technical analysis published on 12/05/2024 (GMT)
- 110
- 0
Click here for a new analysis!
- Timeframe : Daily
- - Analysis generated on
- Status : LEVEL MAINTAINED
Summary of the analysis

Additional analysis
Quotes
TENARIS rating 18.310 EUR. The price registered a decrease of -0.16% on the session with the lowest point at 18.275 EUR and the highest point at 18.395 EUR. The deviation from the price is +0.19% for the low point and -0.46% for the high point.The Central Gaps scanner detects a bearish gap which is a sign that the sellers have taken the lead in the very short term.
Opening Gap DOWN
Type : Bearish
Timeframe : Openning
Here is a more detailed summary of the historical variations registered by TENARIS:
New HIGH record (5 years)
Type : Bullish
Timeframe : Weekly
Near a new HIGH record (1 year)
Type : Bullish
Timeframe : Weekly
Near a new HIGH record (1st january)
Type : Bullish
Timeframe : Weekly
Near a new HIGH record (1 month)
Type : Bullish
Timeframe : Weekly
Technical
Technical analysis of this Daily chart of TENARIS indicates that the overall trend is strongly bullish. 92.86% of the signals given by moving averages are bullish. The overall trend is supported by the strong bullish signals from short-term moving averages. There is no crossing of moving average by the price or crossing of moving averages between themselves.
The probability of a further increase are moderate given the direction of the technical indicators.
Caution: the Central Indicators scanner currently detects an excess:
RSI indicator is overbought : over 80
Type : Neutral
Timeframe : Daily
CCI indicator: bearish divergence
Type : Bearish
Timeframe : Daily
Central Patterns, the market scanner focusing on chart patterns, resistances and supports found this result:
Near resistance of channel
Type : Bearish
Timeframe : Daily
From the Japanese candlestick perspective, the Central Candlesticks scanner notes the presence of these results that could impact the short-term trend:
Bullish doji star
Type : Bullish
Timeframe : Daily
Doji
Type : Neutral
Timeframe : Daily
| S3 | S2 | S1 | Price | |
|---|---|---|---|---|
| ProTrendLines | 14.501 | 16.018 | 17.948 | 18.310 |
| Change (%) | -20.80% | -12.52% | -1.98% | - |
| Change | -3.809 | -2.292 | -0.362 | - |
| Level | Intermediate | Major | Major | - |
Pivot points can also be used to set your price objectives. Here is the price situation in relation to pivot points:
| Pivot points | S3 | S2 | S1 | PP | R1 | R2 | R3 |
|---|---|---|---|---|---|---|---|
| Standard | 17.758 | 18.037 | 18.188 | 18.467 | 18.618 | 18.897 | 19.048 |
| Camarilla | 18.222 | 18.261 | 18.301 | 18.340 | 18.379 | 18.419 | 18.458 |
| Woodie | 17.695 | 18.005 | 18.125 | 18.435 | 18.555 | 18.865 | 18.985 |
| Fibonacci | 18.037 | 18.201 | 18.302 | 18.467 | 18.631 | 18.732 | 18.897 |
| Pivot points | S3 | S2 | S1 | PP | R1 | R2 | R3 |
|---|---|---|---|---|---|---|---|
| Standard | 17.000 | 17.300 | 17.730 | 18.030 | 18.460 | 18.760 | 19.190 |
| Camarilla | 17.959 | 18.026 | 18.093 | 18.160 | 18.227 | 18.294 | 18.361 |
| Woodie | 17.065 | 17.333 | 17.795 | 18.063 | 18.525 | 18.793 | 19.255 |
| Fibonacci | 17.300 | 17.579 | 17.751 | 18.030 | 18.309 | 18.481 | 18.760 |
| Pivot points | S3 | S2 | S1 | PP | R1 | R2 | R3 |
|---|---|---|---|---|---|---|---|
| Standard | 12.617 | 13.793 | 15.977 | 17.153 | 19.337 | 20.513 | 22.697 |
| Camarilla | 17.236 | 17.544 | 17.852 | 18.160 | 18.468 | 18.776 | 19.084 |
| Woodie | 13.120 | 14.045 | 16.480 | 17.405 | 19.840 | 20.765 | 23.200 |
| Fibonacci | 13.793 | 15.077 | 15.870 | 17.153 | 18.437 | 19.230 | 20.513 |
Numerical data
The following are the details of the technical indicators and moving averages that were collected to generate this technical analysis:
| RSI (14): | 82.17 | |
| MACD (12,26,9): | 0.7380 | |
| Directional Movement: | 33.926 | |
| AROON (14): | 78.571 | |
| DEMA (21): | 18.568 | |
| Parabolic SAR (0,02-0,02-0,2): | 18.174 | |
| Elder Ray (13): | 0.410 | |
| Super Trend (3,10): | 17.470 | |
| Zig ZAG (10): | 18.320 | |
| VORTEX (21): | 1.3470 | |
| Stochastique (14,3,5): | 79.88 | |
| TEMA (21): | 18.639 | |
| Williams %R (14): | -26.63 | |
| Chande Momentum Oscillator (20): | 0.925 | |
| Repulse (5,40,3): | -0.9800 | |
| ROCnROLL: | 1 | |
| TRIX (15,9): | 0.7180 | |
| Courbe Coppock: | 12.24 |
| MA7: | 18.209 | |
| MA20: | 17.711 | |
| MA50: | 15.889 | |
| MA100: | 14.492 | |
| MAexp7: | 18.191 | |
| MAexp20: | 17.551 | |
| MAexp50: | 16.258 | |
| MAexp100: | 15.367 | |
| Price / MA7: | +0.55% | |
| Price / MA20: | +3.38% | |
| Price / MA50: | +15.24% | |
| Price / MA100: | +26.35% | |
| Price / MAexp7: | +0.65% | |
| Price / MAexp20: | +4.32% | |
| Price / MAexp50: | +12.62% | |
| Price / MAexp100: | +19.15% |
News
Don't forget to follow the news on TENARIS. At the time of publication of this analysis, the latest news was as follows:
- Glancy Prongay & Murray LLP Obtains Important Ruling for Tenaris S.A. Investors in Securities Fraud Class Action
- TENARIS 24 HOUR DEADLINE ALERT: Approximately 24 Hours Remain; ClaimsFiler Reminds Investors with Losses in Excess of $100,000 of Deadline in Class Action Lawsuit against Tenaris S.A. - TS
- TENARIS 72 HOUR DEADLINE ALERT: Approximately 72 Hours Remain; Former Louisiana Attorney General and Kahn Swick & Foti, LLC Remind Investors with Losses in Excess of $100,000 of Deadline in Class Action Lawsuit against Tenaris S.A. - TS
- Kessler Topaz Meltzer & Check, LLP: Securities Fraud Class Action Filed Against Tenaris S.A. - TS
- TS LOSS DEADLINE: Rosen Law Firm Files First Securities Class Action Lawsuit Against Tenaris S.A.; Reminds of Important Deadline - TS
About author
Online


Add a comment
Comments
0 comments on the analysis TENARIS - Daily