| Open: | - |
| Change: | - |
| Volume: | - |
| Low: | - |
| High: | - |
| High / Low range: | - |
| Type: | Stocks |
| Ticker: | TEP |
| ISIN: | FR0000051807 |
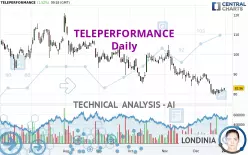
TELEPERFORMANCE - Daily - Technical analysis published on 12/31/2024 (GMT)
- 105
- 0
- 12/31/2024 - 09:35
Click here for a new analysis!
- Timeframe : Daily
- - Analysis generated on 12/31/2024 - 09:35
- Status : TARGET REACHED

Summary of the analysis

Additional analysis
Quotes
The TELEPERFORMANCE rating is 82.96 EUR. The price has increased by +1.52% since the last closing and was traded between 81.88 EUR and 83.08 EUR over the period. The price is currently at +1.32% from its lowest and -0.14% from its highest.The Central Gaps scanner detects a bullish opening marking the presence of buyers ahead of sellers at the opening but not sufficiently marked to allow the price to register a quotation gap.
Bullish opening
Type : Bullish
Timeframe : Openning
Here is a more detailed summary of the historical variations registered by TELEPERFORMANCE:
Near a new LOW record (5 years)
Type : Bearish
Timeframe : Weekly
Near a new LOW record (1 year)
Type : Bearish
Timeframe : Weekly
Near a new LOW record (1st january)
Type : Bearish
Timeframe : Weekly
Near a new LOW record (1 month)
Type : Bearish
Timeframe : Weekly
Technical
Technical analysis of TELEPERFORMANCE in Daily shows a overall strongly bearish trend. The signals given by moving averages are 92.86% bearish. This strong bearish trend is confirmed by the strong signals currently being given by short-term moving averages. The Central Indicators scanner does not detect any result on moving averages that would impact this trend.
In fact, of the 18 technical indicators analysed by Central Analyzer, 7 are bullish, 7 are neutral and 4 are bearish. Other results related to technical indicators were also found by the Central Indicators scanner:
Pivot points : price is over resistance 2
Type : Neutral
Timeframe : Daily
MACD crosses UP its Moving Average
Type : Bullish
Timeframe : Daily
Price is back over the pivot point
Type : Bullish
Timeframe : Weekly
The analysis of the price chart with Central Patterns scanners does not return any result.
No result was found by the Central Candlesticks scanner on Japanese candlesticks.
| S2 | S1 | Price | R1 | R2 | R3 | |
|---|---|---|---|---|---|---|
| ProTrendLines | 21.74 | 81.06 | 82.96 | 93.27 | 100.59 | 120.07 |
| Change (%) | -73.79% | -2.29% | - | +12.43% | +21.25% | +44.73% |
| Change | -61.22 | -1.90 | - | +10.31 | +17.63 | +37.11 |
| Level | Minor | Major | - | Minor | Intermediate | Intermediate |
Pivot points can also be used to set your price objectives. Here is the price situation in relation to pivot points:
| Pivot points | S3 | S2 | S1 | PP | R1 | R2 | R3 |
|---|---|---|---|---|---|---|---|
| Standard | 80.07 | 80.65 | 81.19 | 81.77 | 82.31 | 82.89 | 83.43 |
| Camarilla | 81.41 | 81.52 | 81.62 | 81.72 | 81.82 | 81.93 | 82.03 |
| Woodie | 80.04 | 80.64 | 81.16 | 81.76 | 82.28 | 82.88 | 83.40 |
| Fibonacci | 80.65 | 81.08 | 81.35 | 81.77 | 82.20 | 82.47 | 82.89 |
| Pivot points | S3 | S2 | S1 | PP | R1 | R2 | R3 |
|---|---|---|---|---|---|---|---|
| Standard | 77.51 | 78.91 | 80.53 | 81.93 | 83.55 | 84.95 | 86.57 |
| Camarilla | 81.33 | 81.61 | 81.88 | 82.16 | 82.44 | 82.71 | 82.99 |
| Woodie | 77.63 | 78.97 | 80.65 | 81.99 | 83.67 | 85.01 | 86.69 |
| Fibonacci | 78.91 | 80.06 | 80.77 | 81.93 | 83.08 | 83.79 | 84.95 |
| Pivot points | S3 | S2 | S1 | PP | R1 | R2 | R3 |
|---|---|---|---|---|---|---|---|
| Standard | 59.45 | 71.63 | 80.33 | 92.51 | 101.21 | 113.39 | 122.09 |
| Camarilla | 83.28 | 85.19 | 87.11 | 89.02 | 90.93 | 92.85 | 94.76 |
| Woodie | 57.70 | 70.76 | 78.58 | 91.64 | 99.46 | 112.52 | 120.34 |
| Fibonacci | 71.63 | 79.61 | 84.54 | 92.51 | 100.49 | 105.42 | 113.39 |
Numerical data
The following is the status of the technical indicators and moving averages at the time of publication of this technical analysis:
| RSI (14): | 42.93 | |
| MACD (12,26,9): | -2.4000 | |
| Directional Movement: | -6.93 | |
| AROON (14): | -50.00 | |
| DEMA (21): | 81.01 | |
| Parabolic SAR (0,02-0,02-0,2): | 84.24 | |
| Elder Ray (13): | -0.55 | |
| Super Trend (3,10): | 88.74 | |
| Zig ZAG (10): | 82.96 | |
| VORTEX (21): | 0.8500 | |
| Stochastique (14,3,5): | 26.62 | |
| TEMA (21): | 80.60 | |
| Williams %R (14): | -67.27 | |
| Chande Momentum Oscillator (20): | -4.68 | |
| Repulse (5,40,3): | 1.2900 | |
| ROCnROLL: | -1 | |
| TRIX (15,9): | -0.4100 | |
| Courbe Coppock: | 14.05 |
| MA7: | 81.62 | |
| MA20: | 84.51 | |
| MA50: | 90.08 | |
| MA100: | 94.22 | |
| MAexp7: | 82.15 | |
| MAexp20: | 84.26 | |
| MAexp50: | 88.47 | |
| MAexp100: | 92.96 | |
| Price / MA7: | +1.64% | |
| Price / MA20: | -1.83% | |
| Price / MA50: | -7.90% | |
| Price / MA100: | -11.95% | |
| Price / MAexp7: | +0.99% | |
| Price / MAexp20: | -1.54% | |
| Price / MAexp50: | -6.23% | |
| Price / MAexp100: | -10.76% |
News
The latest news and videos published on TELEPERFORMANCE at the time of the analysis were as follows:
- 12/23/2024 - 17:15 Teleperformance: Statement on Transactions on Own Shares Carried out From December 16 to December 20, 2024 (Inclusive)
- 12/16/2024 - 17:15 Teleperformance SE: Statement on Transactions on Own Shares Carried out from December 9 to December 13, 2024 (inclusive)
- 12/12/2024 - 18:24 Cancellation of Repurchased Shares Representing 1.42% of the Capital of Teleperformance
- 12/04/2024 - 17:18 Teleperformance SE: Monthly Information Regarding Shares and Voting Rights
- 12/03/2024 - 13:03 Frost & Sullivan Recognizes AllianceOne and Central Florida Expressway Authority with 2024 Customer Value Leadership Award
About author
Online


Add a comment
Comments
0 comments on the analysis TELEPERFORMANCE - Daily