| Open: | - |
| Change: | - |
| Volume: | - |
| Low: | - |
| High: | - |
| High / Low range: | - |
| Type: | Stocks |
| Ticker: | TEP |
| ISIN: | FR0000051807 |
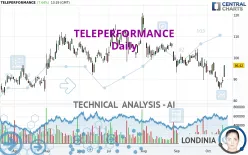
TELEPERFORMANCE - Daily - Technical analysis published on 10/16/2024 (GMT)
- 135
- 0
- 10/16/2024 - 13:35
Click here for a new analysis!
- Timeframe : Daily
- - Analysis generated on 10/16/2024 - 13:35
- Status : LEVEL MAINTAINED

Summary of the analysis

Additional analysis
Quotes
The TELEPERFORMANCE price is 96.42 EUR. On the day, this instrument gained +7.64% with the lowest point at 91.00 EUR and the highest point at 96.48 EUR. The deviation from the price is +5.96% for the low point and -0.06% for the high point.A bullish gap was detected at the opening by the Central Gaps scanner. There are a lot of buyers and they have the upper hand in the very short term.
Opening Gap UP
Type : Bullish
Timeframe : Openning
So that you have an overall view of the price change, here is a table showing the variations over several periods:
Technical
Technical analysis of TELEPERFORMANCE in Daily shows an overall bearish trend. 75.00% of the signals given by moving averages are bearish. Caution: as the signals currently given by short-term moving averages are rather neutral, the bearish trend could slow down. The Central Indicators scanner detects a bullish signal on moving averages that could impact this trend:
Bullish price crossover with Moving Average 20
Type : Bullish
Timeframe : Daily
The probability of a further increase is slight given the direction of the technical indicators.
Central Indicators, the detector scanner for these technical indicators has recently detected several signals:
Pivot points : price is over resistance 1
Type : Neutral
Timeframe : Weekly
Pivot points : price is over resistance 3
Type : Neutral
Timeframe : Daily
RSI indicator is back over 50
Type : Bullish
Timeframe : Daily
MACD crosses UP its Moving Average
Type : Bullish
Timeframe : Daily
Parabolic SAR indicator bullish reversal
Type : Bullish
Timeframe : Daily
Momentum indicator is back over 0
Type : Bullish
Timeframe : Daily
Williams %R indicator is back over -50
Type : Bullish
Timeframe : Daily
The Central Patterns scanner, which studies chart patterns, resistances and supports, has identified this signal:
Near resistance of channel
Type : Bearish
Timeframe : Daily
The Central Candlesticks scanner, specialised in Japanese candlesticks, did not identify any signals.
| S3 | S2 | S1 | Price | R1 | R2 | R3 | |
|---|---|---|---|---|---|---|---|
| ProTrendLines | 21.79 | 81.06 | 87.75 | 96.42 | 102.19 | 119.20 | 138.85 |
| Change (%) | -77.40% | -15.93% | -8.99% | - | +5.98% | +23.63% | +44.01% |
| Change | -74.63 | -15.36 | -8.67 | - | +5.77 | +22.78 | +42.43 |
| Level | Intermediate | Major | Intermediate | - | Major | Intermediate | Minor |
To determine price objectives, it is also possible to use the pivot points. Here is the price position in relation to pivot points:
| Pivot points | S3 | S2 | S1 | PP | R1 | R2 | R3 |
|---|---|---|---|---|---|---|---|
| Standard | 85.26 | 86.70 | 88.14 | 89.58 | 91.02 | 92.46 | 93.90 |
| Camarilla | 88.79 | 89.05 | 89.32 | 89.58 | 89.84 | 90.11 | 90.37 |
| Woodie | 85.26 | 86.70 | 88.14 | 89.58 | 91.02 | 92.46 | 93.90 |
| Fibonacci | 86.70 | 87.80 | 88.48 | 89.58 | 90.68 | 91.36 | 92.46 |
| Pivot points | S3 | S2 | S1 | PP | R1 | R2 | R3 |
|---|---|---|---|---|---|---|---|
| Standard | 70.38 | 77.82 | 83.12 | 90.56 | 95.86 | 103.30 | 108.60 |
| Camarilla | 84.92 | 86.08 | 87.25 | 88.42 | 89.59 | 90.76 | 91.92 |
| Woodie | 69.31 | 77.29 | 82.05 | 90.03 | 94.79 | 102.77 | 107.53 |
| Fibonacci | 77.82 | 82.69 | 85.69 | 90.56 | 95.43 | 98.43 | 103.30 |
| Pivot points | S3 | S2 | S1 | PP | R1 | R2 | R3 |
|---|---|---|---|---|---|---|---|
| Standard | 72.27 | 80.89 | 86.95 | 95.57 | 101.63 | 110.25 | 116.31 |
| Camarilla | 88.96 | 90.31 | 91.65 | 93.00 | 94.35 | 95.69 | 97.04 |
| Woodie | 70.98 | 80.25 | 85.66 | 94.93 | 100.34 | 109.61 | 115.02 |
| Fibonacci | 80.89 | 86.50 | 89.97 | 95.57 | 101.18 | 104.65 | 110.25 |
Numerical data
The following is the status of technical indicators and moving averages registered at the time this technical analysis was created:
| RSI (14): | 52.89 | |
| MACD (12,26,9): | -2.4400 | |
| Directional Movement: | 2.85 | |
| AROON (14): | -71.43 | |
| DEMA (21): | 90.20 | |
| Parabolic SAR (0,02-0,02-0,2): | 85.26 | |
| Elder Ray (13): | 1.55 | |
| Super Trend (3,10): | 97.50 | |
| Zig ZAG (10): | 96.36 | |
| VORTEX (21): | 0.8000 | |
| Stochastique (14,3,5): | 41.79 | |
| TEMA (21): | 89.59 | |
| Williams %R (14): | -20.17 | |
| Chande Momentum Oscillator (20): | 3.42 | |
| Repulse (5,40,3): | 7.1600 | |
| ROCnROLL: | -1 | |
| TRIX (15,9): | -0.3700 | |
| Courbe Coppock: | 13.32 |
| MA7: | 89.76 | |
| MA20: | 93.95 | |
| MA50: | 98.38 | |
| MA100: | 101.71 | |
| MAexp7: | 91.38 | |
| MAexp20: | 93.47 | |
| MAexp50: | 97.24 | |
| MAexp100: | 99.96 | |
| Price / MA7: | +7.42% | |
| Price / MA20: | +2.63% | |
| Price / MA50: | -1.99% | |
| Price / MA100: | -5.20% | |
| Price / MAexp7: | +5.52% | |
| Price / MAexp20: | +3.16% | |
| Price / MAexp50: | -0.84% | |
| Price / MAexp100: | -3.54% |
News
The latest news and videos published on TELEPERFORMANCE at the time of the analysis were as follows:
- 09/10/2024 - 13:03 Teleperformance strengthens Cloud as a Service offering with two new service delivery partner designations
- 09/03/2024 - 17:02 Teleperformance awarded 'Best Remote Agent Program' across Europe, Middle East, and Africa in 2024 by the world's largest contact center association
- 09/03/2024 - 04:30 Teleperformance in India Recognized by Frost & Sullivan with the 2024 Customer Value Leadership Award in the Asia-Pacific Customer Care Outsourcing Industry
- 09/03/2024 - 04:30 Teleperformance in India Recognized by Frost & Sullivan with the 2024 Customer Value Leadership Award in the Asia-Pacific Customer Care Outsourcing Industry
- 08/20/2024 - 13:02 Teleperformance ranked among top 5 Best Multinational Workplaces in Latin America
About author
Online


Add a comment
Comments
0 comments on the analysis TELEPERFORMANCE - Daily