| Open: | 20,041.21 |
| Change: | +426.49 |
| Volume: | 8,123,632 |
| Low: | 20,024.97 |
| High: | 20,208.84 |
| High / Low range: | 183.87 |
| Type: | Stocks |
| Ticker: | TEF |
| ISIN: | ES0178430E18 |
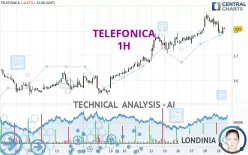
TELEFONICA - 1H - Technical analysis published on 02/29/2024 (GMT)
- 164
- 0
- 02/29/2024 - 12:25
Click here for a new analysis!
- Timeframe : 1H
- - Analysis generated on 02/29/2024 - 12:25
- Status : LEVEL MAINTAINED

Summary of the analysis

Additional analysis
Quotes
TELEFONICA rating 3.813 EUR. On the day, this instrument lost -0.39% with the lowest point at 3.790 EUR and the highest point at 3.842 EUR. The deviation from the price is +0.61% for the low point and -0.75% for the high point.A study of price movements over other periods shows the following variations:
Near a new HIGH record (1 year)
Type : Bullish
Timeframe : Weekly
Near a new HIGH record (1st january)
Type : Bullish
Timeframe : Weekly
Near a new HIGH record (1 month)
Type : Bullish
Timeframe : Weekly
Technical
Technical analysis of this 1H chart of TELEFONICA indicates that the overall trend is strongly bullish. The signals given by moving averages are 85.71% bullish. This strongly bullish trend seems to be running out of steam given the signals being given by short-term moving averages. An assessment of moving averages reveals a bullish signal that could impact this trend:
Bullish trend reversal : adaptative moving average 20
Type : Bullish
Timeframe : 1 hour
In fact, according to the parameters integrated into the Central Analyzer system, only 7 technical indicators out of 18 analysed are currently bearish. The Central Indicators scanner found this result concerning these indicators:
RSI indicator is back over 50
Type : Bullish
Timeframe : 1 hour
The Central Patterns scanner, which studies chart patterns, resistances and supports, has identified these signals:
Near horizontal support
Type : Bullish
Timeframe : 1 hour
Support of channel is broken
Type : Bearish
Timeframe : 1 hour
The Central Candlesticks scanner which studies Japanese candlesticks did not detect anything.
| S3 | S2 | S1 | Price | R1 | R2 | R3 | |
|---|---|---|---|---|---|---|---|
| ProTrendLines | 3.553 | 3.638 | 3.732 | 3.813 | 3.817 | 3.874 | 3.936 |
| Change (%) | -6.82% | -4.59% | -2.12% | - | +0.10% | +1.60% | +3.23% |
| Change | -0.260 | -0.175 | -0.081 | - | +0.004 | +0.061 | +0.123 |
| Level | Major | Minor | Intermediate | - | Major | Intermediate | Intermediate |
To determine price objectives, it is also possible to use the pivot points. Here is the price position in relation to pivot points:
| Pivot points | S3 | S2 | S1 | PP | R1 | R2 | R3 |
|---|---|---|---|---|---|---|---|
| Standard | 3.743 | 3.779 | 3.803 | 3.839 | 3.863 | 3.899 | 3.923 |
| Camarilla | 3.812 | 3.817 | 3.823 | 3.828 | 3.834 | 3.839 | 3.845 |
| Woodie | 3.738 | 3.776 | 3.798 | 3.836 | 3.858 | 3.896 | 3.918 |
| Fibonacci | 3.779 | 3.802 | 3.816 | 3.839 | 3.862 | 3.876 | 3.899 |
| Pivot points | S3 | S2 | S1 | PP | R1 | R2 | R3 |
|---|---|---|---|---|---|---|---|
| Standard | 3.410 | 3.489 | 3.633 | 3.712 | 3.856 | 3.935 | 4.079 |
| Camarilla | 3.715 | 3.735 | 3.756 | 3.776 | 3.796 | 3.817 | 3.837 |
| Woodie | 3.442 | 3.505 | 3.665 | 3.728 | 3.888 | 3.951 | 4.111 |
| Fibonacci | 3.489 | 3.575 | 3.627 | 3.712 | 3.798 | 3.850 | 3.935 |
| Pivot points | S3 | S2 | S1 | PP | R1 | R2 | R3 |
|---|---|---|---|---|---|---|---|
| Standard | 3.270 | 3.405 | 3.588 | 3.723 | 3.906 | 4.041 | 4.224 |
| Camarilla | 3.683 | 3.712 | 3.741 | 3.770 | 3.799 | 3.828 | 3.858 |
| Woodie | 3.293 | 3.417 | 3.611 | 3.735 | 3.929 | 4.053 | 4.247 |
| Fibonacci | 3.405 | 3.527 | 3.602 | 3.723 | 3.845 | 3.920 | 4.041 |
Numerical data
The following is the status of technical indicators and moving averages registered at the time this technical analysis was created:
| RSI (14): | 54.20 | |
| MACD (12,26,9): | 0.0100 | |
| Directional Movement: | 5.991 | |
| AROON (14): | -71.428 | |
| DEMA (21): | 3.827 | |
| Parabolic SAR (0,02-0,02-0,2): | 3.856 | |
| Elder Ray (13): | 0.001 | |
| Super Trend (3,10): | 3.858 | |
| Zig ZAG (10): | 3.813 | |
| VORTEX (21): | 1.0980 | |
| Stochastique (14,3,5): | 20.59 | |
| TEMA (21): | 3.817 | |
| Williams %R (14): | -72.62 | |
| Chande Momentum Oscillator (20): | -0.050 | |
| Repulse (5,40,3): | -0.0220 | |
| ROCnROLL: | -1 | |
| TRIX (15,9): | 0.0630 | |
| Courbe Coppock: | 0.13 |
| MA7: | 3.776 | |
| MA20: | 3.669 | |
| MA50: | 3.694 | |
| MA100: | 3.675 | |
| MAexp7: | 3.812 | |
| MAexp20: | 3.811 | |
| MAexp50: | 3.776 | |
| MAexp100: | 3.734 | |
| Price / MA7: | +0.98% | |
| Price / MA20: | +3.92% | |
| Price / MA50: | +3.22% | |
| Price / MA100: | +3.76% | |
| Price / MAexp7: | +0.03% | |
| Price / MAexp20: | +0.05% | |
| Price / MAexp50: | +0.98% | |
| Price / MAexp100: | +2.12% |
News
Don't forget to follow the news on TELEFONICA. At the time of publication of this analysis, the latest news was as follows:
- 02/29/2024 - 09:52 ZTE pioneers innovative green solution for zero-carbon communication for Telefónica Germany
- 02/22/2024 - 22:29 TELEFÔNICA BRASIL S.A. ANNOUNCES THE FILING OF ITS ANNUAL REPORT ON FORM 20-F FOR FISCAL YEAR 2023
- 02/20/2024 - 22:41 4Q23 and 2023 Results: Telefônica Brasil S.A.
- 01/24/2024 - 12:00 Telefónica and Nova Labs launch Helium Mobile Hotspots in Mexico
- 11/17/2023 - 11:50 With INA, Sopra Steria and Telefónica are propelling the telecommunications industry into the quantum era and revolutionising network management
About author
Online


Add a comment
Comments
0 comments on the analysis TELEFONICA - 1H