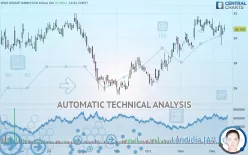
DWS GROUP GMBH+CO.KGAA ON - Daily - Technical analysis published on 12/12/2019 (GMT)
- 248
- 0
- Who voted?
Click here for a new analysis!
- Timeframe : Daily
- - Analysis generated on
- Status : TARGET REACHED

Summary of the analysis

Additional analysis
Quotes
The DWS GROUP GMBH+CO.KGAA ON price is 30.705 EUR. The price has increased by +0.38% since the last closing and was between 30.505 EUR and 31.085 EUR. This implies that the price is at +0.66% from its lowest and at -1.22% from its highest.The Central Gaps scanner detects a bullish opening marking the presence of buyers ahead of sellers at the opening but not sufficiently marked to allow the price to register a quotation gap.
Bullish opening
Type : Bullish
Timeframe : Openning
A study of price movements over other periods shows the following variations:
Technical
Technical analysis of this Daily chart of DWS GROUP GMBH+CO.KGAA ON indicates that the overall trend is bullish. The signals given by moving averages are 71.43% bullish. This bullish trend is slowing down slightly given the slightly bullish signals of short-term moving averages. The Central Indicators scanner detects a bullish signal on moving averages that could impact this trend:
Bullish price crossover with adaptative moving average 20
Type : Bullish
Timeframe : Daily
In fact, Central Analyzer took into account 18 technical indicators and the result was as follows: 6 are bullish, 8 are neutral and 4 are bearish. But beware of excesses. The Central Indicators scanner currently detects this:
MACD indicator: bullish divergence
Type : Bullish
Timeframe : Daily
Williams %R indicator is overbought : over -20
Type : Neutral
Timeframe : Daily
RSI indicator is back over 50
Type : Bullish
Timeframe : Daily
Price is back over the pivot point
Type : Bullish
Timeframe : Daily
Williams %R indicator is back over -50
Type : Bullish
Timeframe : Daily
An analysis of the price chart with the Central Patterns scanner (detector of chart patterns and resistances and supports) shows a result that can have an impact on the price change:
Near support of channel
Type : Bullish
Timeframe : Daily
The Central Candlesticks scanner, specialised in Japanese candlesticks, did not identify any signals.
| S3 | S2 | S1 | Price | R1 | R2 | R3 | |
|---|---|---|---|---|---|---|---|
| ProTrendLines | 26.398 | 28.942 | 30.213 | 30.705 | 31.456 | 32.252 | 33.140 |
| Change (%) | -14.03% | -5.74% | -1.60% | - | +2.45% | +5.04% | +7.93% |
| Change | -4.307 | -1.763 | -0.492 | - | +0.751 | +1.547 | +2.435 |
| Level | Minor | Major | Major | - | Major | Minor | Intermediate |
Attention could also be paid to pivot points to set price objectives:
| Pivot points | S3 | S2 | S1 | PP | R1 | R2 | R3 |
|---|---|---|---|---|---|---|---|
| Standard | 29.778 | 30.027 | 30.308 | 30.557 | 30.838 | 31.087 | 31.368 |
| Camarilla | 30.444 | 30.493 | 30.541 | 30.590 | 30.639 | 30.687 | 30.736 |
| Woodie | 29.795 | 30.035 | 30.325 | 30.565 | 30.855 | 31.095 | 31.385 |
| Fibonacci | 30.027 | 30.229 | 30.354 | 30.557 | 30.759 | 30.884 | 31.087 |
| Pivot points | S3 | S2 | S1 | PP | R1 | R2 | R3 |
|---|---|---|---|---|---|---|---|
| Standard | 28.775 | 29.470 | 30.195 | 30.890 | 31.615 | 32.310 | 33.035 |
| Camarilla | 30.530 | 30.660 | 30.790 | 30.920 | 31.050 | 31.180 | 31.311 |
| Woodie | 28.790 | 29.478 | 30.210 | 30.898 | 31.630 | 32.318 | 33.050 |
| Fibonacci | 29.470 | 30.012 | 30.348 | 30.890 | 31.432 | 31.768 | 32.310 |
| Pivot points | S3 | S2 | S1 | PP | R1 | R2 | R3 |
|---|---|---|---|---|---|---|---|
| Standard | 26.587 | 27.793 | 29.327 | 30.533 | 32.067 | 33.273 | 34.807 |
| Camarilla | 30.107 | 30.358 | 30.609 | 30.860 | 31.111 | 31.362 | 31.614 |
| Woodie | 26.750 | 27.875 | 29.490 | 30.615 | 32.230 | 33.355 | 34.970 |
| Fibonacci | 27.793 | 28.840 | 29.487 | 30.533 | 31.580 | 32.227 | 33.273 |
Numerical data
The following is the status of the technical indicators and moving averages at the time of publication of this technical analysis:
| RSI (14): | 53.88 | |
| MACD (12,26,9): | 0.2630 | |
| Directional Movement: | -0.738 | |
| AROON (14): | -42.857 | |
| DEMA (21): | 31.007 | |
| Parabolic SAR (0,02-0,02-0,2): | 31.648 | |
| Elder Ray (13): | 0.125 | |
| Super Trend (3,10): | 29.379 | |
| Zig ZAG (10): | 30.675 | |
| VORTEX (21): | 1.0280 | |
| Stochastique (14,3,5): | 50.61 | |
| TEMA (21): | 30.764 | |
| Williams %R (14): | -42.17 | |
| Chande Momentum Oscillator (20): | -0.800 | |
| Repulse (5,40,3): | -0.9330 | |
| ROCnROLL: | -1 | |
| TRIX (15,9): | 0.2000 | |
| Courbe Coppock: | 2.29 |
| MA7: | 30.667 | |
| MA20: | 30.885 | |
| MA50: | 29.500 | |
| MA100: | 28.532 | |
| MAexp7: | 30.667 | |
| MAexp20: | 30.566 | |
| MAexp50: | 29.812 | |
| MAexp100: | 29.251 | |
| Price / MA7: | +0.12% | |
| Price / MA20: | -0.58% | |
| Price / MA50: | +4.08% | |
| Price / MA100: | +7.62% | |
| Price / MAexp7: | +0.12% | |
| Price / MAexp20: | +0.45% | |
| Price / MAexp50: | +3.00% | |
| Price / MAexp100: | +4.97% |
News
Don"t forget to follow the news on DWS GROUP GMBH+CO.KGAA ON. At the time of publication of this analysis, the latest news was as follows:
- DGAP-News: DWS Q3: Third Consecutive Quarter of Net New Assets Marks Flow Turnaround - Cost-Income Ratio Well on Track for Full-Year Target
- DGAP-News: DWS Q2: Continued Positive Flow Momentum - Cost-Income Ratio on Track for Full-Year Target
- DGAP-News: DWS Q1: Positive Net Flows and Further Accelerated Cost Reductions
- DGAP-News: DWS Q4: Costs down as full year guidance exceeded - challenging market conditions impact revenues and profits
- DGAP-Adhoc: DWS Group GmbH & Co. KGaA: Asoka Wöhrmann appointed new CEO of DWS as Nicolas Moreau resigns
About author

Online


Add a comment
Comments
0 comments on the analysis DWS GROUP GMBH+CO.KGAA ON - Daily