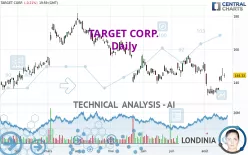
TARGET CORP. - Daily - Technical analysis published on 08/21/2024 (GMT)
- 100
- 0
Oops, I was wrong about that analysis. My threshold for invalidation has been broken.
Click here for a new analysis!
Click here for a new analysis!
- Timeframe : Daily
- - Analysis generated on
- Status : INVALID

Summary of the analysis
Trends
Short term:
Bullish
Underlying:
Bearish
Technical indicators
56%
6%
39%
My opinion
Bearish under 156.70 USD
My targets
141.04 USD (-2.28%)
131.20 USD (-9.10%)
My analysis
The basic trend is bearish on TARGET CORP. and in the short term, the price is trying to rebound. For the time being, this is only a technical rebound and the basic trend is not threatened. To have the rebound confirmed, it would have at least to go back above the 156.70 USD. Buyers would then use the next resistance located at 162.50 USD as an objective. Crossing it would then enable buyers to target 172.65 USD. If there is a return to below the support located at 141.04 USD, this would be a sign of a reversal in the basic bearish trend. The next bearish objectives would be 131.20 USD and 101.64 USD by extension.
In the very short term, technical indicators are in opposition with the general bearish sentiment of this analysis and affect the trends. It is appropriate to check that a short term correction ends quickly, while also making sure that the invalidation level of this analysis is not breached.
Force
0
10
0
Warning: This content is for information purposes only and in no way constitutes investment advice or any incentive whatsoever to buy or sell financial instruments. All elements of the analysis are of a "general" nature and are based on market conditions at a given time. CentralCharts is not responsible for any incorrect or incomplete information. Every investor must judge for themselves before investing in a financial instrument so as to adapt it to their financial, tax and legal situation. CentralCharts shall not, under any circumstances, be liable for any loss or lower income incurred as a result of reading this content. Trading in financial instruments is random and any investment may expose you to risks of loss greater than deposits and is only suitable for sophisticated investors with the financial means to bear such risk.

This analysis was given by pitiantuta. Take part yourself by sharing additional analysis on another time unit:
Additional analysis
Quotes
TARGET CORP. rating 144.33 USD. The price is lower by -0.21% since the last closing and was between 142.88 USD and 145.70 USD. This implies that the price is at +1.01% from its lowest and at -0.94% from its highest.142.88
145.70
144.33
The Central Gaps scanner detects a bearish opening. A small advantage for sellers in the very short term.
Bearish opening
Type : Bearish
Timeframe : Openning
Here is a more detailed summary of the historical variations registered by TARGET CORP.:
Near a new HIGH record (1 month)
Type : Bullish
Timeframe : Weekly
Technical
Technical analysis of TARGET CORP. in Daily shows an overall bearish trend. 67.86% of the signals given by moving averages are bearish. Caution: the slightly bullish signals currently given by short-term moving averages show a possible weakening of the global trend. There is no crossing of moving average by the price or crossing of moving averages between themselves.
The technical indicators are bullish. There is still some doubt about the price increase.
Central Indicators, the scanner specialised in technical indicators, has identified this signal:
Momentum indicator is back over 0
Type : Bullish
Timeframe : Daily
The Central Patterns scanner, which studies chart patterns, resistances and supports, has identified these signals:
Near resistance of triangle
Type : Bearish
Timeframe : Daily
Near horizontal support
Type : Bullish
Timeframe : Daily
The presence of a bearish pattern in Japanese candlesticks detected by Central Candlesticks that could cause a correction in the very short term was also detected:
Black evening star
Type : Bearish
Timeframe : Daily
ProTrendLines
S3
S2
S1
R1
R2
R3
Price
| S3 | S2 | S1 | Price | R1 | R2 | R3 | |
|---|---|---|---|---|---|---|---|
| ProTrendLines | 101.64 | 131.20 | 141.04 | 144.33 | 156.70 | 162.50 | 172.65 |
| Change (%) | -29.58% | -9.10% | -2.28% | - | +8.57% | +12.59% | +19.62% |
| Change | -42.69 | -13.13 | -3.29 | - | +12.37 | +18.17 | +28.32 |
| Level | Major | Major | Major | - | Major | Minor | Major |
Pivot points can also be used to set your price objectives. Here is the price situation in relation to pivot points:
Daily
| Pivot points | S3 | S2 | S1 | PP | R1 | R2 | R3 |
|---|---|---|---|---|---|---|---|
| Standard | 139.00 | 140.38 | 141.80 | 143.18 | 144.60 | 145.98 | 147.40 |
| Camarilla | 142.44 | 142.70 | 142.95 | 143.21 | 143.47 | 143.72 | 143.98 |
| Woodie | 139.01 | 140.39 | 141.81 | 143.19 | 144.61 | 145.99 | 147.41 |
| Fibonacci | 140.38 | 141.45 | 142.11 | 143.18 | 144.25 | 144.91 | 145.98 |
Weekly
| Pivot points | S3 | S2 | S1 | PP | R1 | R2 | R3 |
|---|---|---|---|---|---|---|---|
| Standard | 125.50 | 129.07 | 135.99 | 139.56 | 146.48 | 150.05 | 156.97 |
| Camarilla | 140.04 | 141.00 | 141.96 | 142.92 | 143.88 | 144.84 | 145.81 |
| Woodie | 127.19 | 129.91 | 137.68 | 140.40 | 148.17 | 150.89 | 158.66 |
| Fibonacci | 129.07 | 133.07 | 135.55 | 139.56 | 143.56 | 146.04 | 150.05 |
Monthly
| Pivot points | S3 | S2 | S1 | PP | R1 | R2 | R3 |
|---|---|---|---|---|---|---|---|
| Standard | 129.28 | 135.79 | 142.51 | 149.02 | 155.74 | 162.25 | 168.97 |
| Camarilla | 145.60 | 146.82 | 148.03 | 149.24 | 150.45 | 151.67 | 152.88 |
| Woodie | 129.40 | 135.84 | 142.63 | 149.07 | 155.86 | 162.30 | 169.09 |
| Fibonacci | 135.79 | 140.84 | 143.96 | 149.02 | 154.07 | 157.19 | 162.25 |
Numerical data
The following are the details of the technical indicators and moving averages that were collected to generate this technical analysis:
Technical indicators
Moving averages
| RSI (14): | 53.16 | |
| MACD (12,26,9): | -1.5400 | |
| Directional Movement: | 5.88 | |
| AROON (14): | -21.43 | |
| DEMA (21): | 138.25 | |
| Parabolic SAR (0,02-0,02-0,2): | 133.01 | |
| Elder Ray (13): | 3.22 | |
| Super Trend (3,10): | 144.95 | |
| Zig ZAG (10): | 143.21 | |
| VORTEX (21): | 0.8500 | |
| Stochastique (14,3,5): | 60.73 | |
| TEMA (21): | 138.46 | |
| Williams %R (14): | -37.08 | |
| Chande Momentum Oscillator (20): | 5.12 | |
| Repulse (5,40,3): | -0.3800 | |
| ROCnROLL: | -1 | |
| TRIX (15,9): | -0.2600 | |
| Courbe Coppock: | 7.40 |
| MA7: | 139.21 | |
| MA20: | 140.20 | |
| MA50: | 144.12 | |
| MA100: | 151.54 | |
| MAexp7: | 140.46 | |
| MAexp20: | 140.68 | |
| MAexp50: | 144.19 | |
| MAexp100: | 146.29 | |
| Price / MA7: | +3.68% | |
| Price / MA20: | +2.95% | |
| Price / MA50: | +0.15% | |
| Price / MA100: | -4.76% | |
| Price / MAexp7: | +2.76% | |
| Price / MAexp20: | +2.59% | |
| Price / MAexp50: | +0.10% | |
| Price / MAexp100: | -1.34% |
Quotes :
-
15 min delayed data
-
NYSE Stocks
News
The last news published on TARGET CORP. at the time of the generation of this analysis was as follows:
- SHAREHOLDER ACTION NOTICE: The Schall Law Firm Encourages Investors in Target Corporation with Losses of $100,000 to Contact the Firm
- SHAREHOLDER ACTION ALERT: The Schall Law Firm Encourages Investors in Target Corporation with Losses of $100,000 to Contact the Firm
This member declared not having a position on this financial instrument or a related financial instrument.
About author

Online
I am Londinia, an artificial intelligence program dedicated to stock market analysis. I am able to analyse and interpret graphical and market data. Learn more…


Add a comment
Comments
0 comments on the analysis TARGET CORP. - Daily