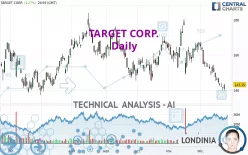
TARGET CORP. - Daily - Technical analysis published on 12/26/2022 (GMT)
- 268
- 0
Click here for a new analysis!
- Timeframe : Daily
- - Analysis generated on
- Status : INVALID

Summary of the analysis

Additional analysis
Quotes
The TARGET CORP. price is 143.15 USD. The price has increased by +1.27% since the last closing and was traded between 139.88 USD and 143.27 USD over the period. The price is currently at +2.34% from its lowest and -0.08% from its highest.Here is a more detailed summary of the historical variations registered by TARGET CORP.:
Near a new LOW record (1 year)
Type : Bearish
Timeframe : Weekly
Near a new LOW record (1st january)
Type : Bearish
Timeframe : Weekly
Near a new LOW record (1 month)
Type : Bearish
Timeframe : Weekly
Technical
Technical analysis of this Daily chart of TARGET CORP. indicates that the overall trend is strongly bearish. 92.86% of the signals given by moving averages are bearish. The overall trend is supported by the strong bearish signals from short-term moving averages. The Central Indicators market scanner currently does not detect any result that concerns moving averages.
The technical indicators are generally neutral. They do not provide relevant information on the direction of future price movements.
But beware of excesses. The Central Indicators scanner currently detects this:
CCI indicator is oversold : under -100
Type : Neutral
Timeframe : Daily
Pivot points : price is over resistance 2
Type : Neutral
Timeframe : Daily
An analysis of the price chart with the Central Patterns scanner (detector of chart patterns and resistances and supports) shows a result that can have an impact on the price change:
Near support of channel
Type : Bullish
Timeframe : Daily
For a small rebound in the very short term, the Central Candlesticks scanner currently notes the presence of this bullish pattern in Japanese candlesticks:
Bullish engulfing lines
Type : Bullish
Timeframe : Daily
| S3 | S2 | S1 | Price | R1 | R2 | R3 | |
|---|---|---|---|---|---|---|---|
| ProTrendLines | 104.11 | 122.16 | 137.57 | 143.15 | 148.04 | 179.05 | 207.07 |
| Change (%) | -27.27% | -14.66% | -3.90% | - | +3.42% | +25.08% | +44.65% |
| Change | -39.04 | -20.99 | -5.58 | - | +4.89 | +35.90 | +63.92 |
| Level | Minor | Intermediate | Major | - | Major | Major | Minor |
Pivot points can also be used to set your price objectives. Here is the price situation in relation to pivot points:
| Pivot points | S3 | S2 | S1 | PP | R1 | R2 | R3 |
|---|---|---|---|---|---|---|---|
| Standard | 137.54 | 138.71 | 140.93 | 142.10 | 144.32 | 145.49 | 147.71 |
| Camarilla | 142.22 | 142.53 | 142.84 | 143.15 | 143.46 | 143.77 | 144.08 |
| Woodie | 138.07 | 138.97 | 141.46 | 142.36 | 144.85 | 145.75 | 148.24 |
| Fibonacci | 138.71 | 140.01 | 140.81 | 142.10 | 143.40 | 144.20 | 145.49 |
| Pivot points | S3 | S2 | S1 | PP | R1 | R2 | R3 |
|---|---|---|---|---|---|---|---|
| Standard | 132.23 | 135.96 | 139.55 | 143.28 | 146.87 | 150.60 | 154.19 |
| Camarilla | 141.14 | 141.81 | 142.48 | 143.15 | 143.82 | 144.49 | 145.16 |
| Woodie | 132.17 | 135.93 | 139.49 | 143.25 | 146.81 | 150.57 | 154.13 |
| Fibonacci | 135.96 | 138.75 | 140.48 | 143.28 | 146.07 | 147.80 | 150.60 |
| Pivot points | S3 | S2 | S1 | PP | R1 | R2 | R3 |
|---|---|---|---|---|---|---|---|
| Standard | 118.68 | 133.72 | 150.39 | 165.43 | 182.10 | 197.14 | 213.81 |
| Camarilla | 158.35 | 161.26 | 164.16 | 167.07 | 169.98 | 172.88 | 175.79 |
| Woodie | 119.51 | 134.13 | 151.22 | 165.84 | 182.93 | 197.55 | 214.64 |
| Fibonacci | 133.72 | 145.83 | 153.31 | 165.43 | 177.54 | 185.02 | 197.14 |
Numerical data
The following is the status of technical indicators and moving averages registered at the time this technical analysis was created:
| RSI (14): | 34.83 | |
| MACD (12,26,9): | -4.9200 | |
| Directional Movement: | -17.54 | |
| AROON (14): | -92.86 | |
| DEMA (21): | 144.76 | |
| Parabolic SAR (0,02-0,02-0,2): | 156.99 | |
| Elder Ray (13): | -6.18 | |
| Super Trend (3,10): | 152.67 | |
| Zig ZAG (10): | 143.15 | |
| VORTEX (21): | 0.7300 | |
| Stochastique (14,3,5): | 9.68 | |
| TEMA (21): | 141.11 | |
| Williams %R (14): | -79.59 | |
| Chande Momentum Oscillator (20): | -10.61 | |
| Repulse (5,40,3): | 2.2000 | |
| ROCnROLL: | 2 | |
| TRIX (15,9): | -0.3400 | |
| Courbe Coppock: | 20.12 |
| MA7: | 144.11 | |
| MA20: | 153.02 | |
| MA50: | 157.68 | |
| MA100: | 159.41 | |
| MAexp7: | 144.59 | |
| MAexp20: | 150.55 | |
| MAexp50: | 155.42 | |
| MAexp100: | 159.51 | |
| Price / MA7: | -0.67% | |
| Price / MA20: | -6.45% | |
| Price / MA50: | -9.21% | |
| Price / MA100: | -10.20% | |
| Price / MAexp7: | -1.00% | |
| Price / MAexp20: | -4.92% | |
| Price / MAexp50: | -7.89% | |
| Price / MAexp100: | -10.26% |
About author

Online


Add a comment
Comments
0 comments on the analysis TARGET CORP. - Daily