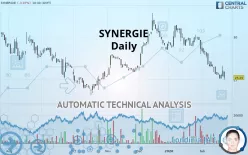
SYNERGIE - Daily - Technical analysis published on 02/24/2020 (GMT)
- 422
- 0
- Who voted?
Click here for a new analysis!
- Timeframe : Daily
- - Analysis generated on
- Status : TARGET REACHED

Summary of the analysis

Additional analysis
Quotes
The SYNERGIE price is 25.25 EUR. On the day, this instrument lost -3.07% and was between 25.00 EUR and 25.95 EUR. This implies that the price is at +1.00% from its lowest and at -2.70% from its highest.The Central Gaps scanner detects a bearish opening marking the presence of sellers ahead of buyers at the opening but not sufficiently marked to allow the price to register a quotation gap.
Bearish opening
Type : Bearish
Timeframe : Openning
So that you have an overall view of the price change, here is a table showing the variations over several periods:
Technical
Technical analysis of SYNERGIE in Daily shows an overall bearish trend. The signals given by moving averages are 78.57% bearish. This bearish trend is reinforced by the strong signals currently being given by short-term moving averages. The Central Indicators market scanner is currently detecting a bullish signal that could impact this trend:
Bullish trend reversal : Moving Average 100
Type : Bullish
Timeframe : Daily
An assessment of technical indicators does not currently provide any relevant information on the direction of future price movements.
Central Indicators, the detector scanner for these technical indicators has recently detected several signals:
Pivot points : price is under support 1
Type : Neutral
Timeframe : Daily
Pivot points : price is under support 1
Type : Neutral
Timeframe : Weekly
Parabolic SAR indicator bullish reversal
Type : Bullish
Timeframe : Daily
Price is back over the pivot point
Type : Bullish
Timeframe : Daily
Price is back over the pivot point
Type : Bullish
Timeframe : Weekly
An analysis of the price chart with the Central Patterns scanner (detector of chart patterns and resistances and supports) shows a result that can have an impact on the price change:
Near horizontal support
Type : Bullish
Timeframe : Daily
The Central Candlesticks scanner which studies Japanese candlesticks did not detect anything.
| S3 | S2 | S1 | R1 | Price | R2 | R3 | |
|---|---|---|---|---|---|---|---|
| ProTrendLines | 13.50 | 22.78 | 23.80 | 25.25 | 25.25 | 26.59 | 27.82 |
| Change (%) | -46.53% | -9.78% | -5.74% | 0% | - | +5.31% | +10.18% |
| Change | -11.75 | -2.47 | -1.45 | 0 | - | +1.34 | +2.57 |
| Level | Intermediate | Major | Major | Minor | - | Major | Minor |
To determine price objectives, it is also possible to use the pivot points. Here is the price position in relation to pivot points:
| Pivot points | S3 | S2 | S1 | PP | R1 | R2 | R3 |
|---|---|---|---|---|---|---|---|
| Standard | 24.17 | 24.78 | 25.42 | 26.03 | 26.67 | 27.28 | 27.92 |
| Camarilla | 25.71 | 25.82 | 25.94 | 26.05 | 26.17 | 26.28 | 26.39 |
| Woodie | 24.18 | 24.79 | 25.43 | 26.04 | 26.68 | 27.29 | 27.93 |
| Fibonacci | 24.78 | 25.26 | 25.56 | 26.03 | 26.51 | 26.81 | 27.28 |
| Pivot points | S3 | S2 | S1 | PP | R1 | R2 | R3 |
|---|---|---|---|---|---|---|---|
| Standard | 23.75 | 24.45 | 25.25 | 25.95 | 26.75 | 27.45 | 28.25 |
| Camarilla | 25.64 | 25.78 | 25.91 | 26.05 | 26.19 | 26.33 | 26.46 |
| Woodie | 23.80 | 24.48 | 25.30 | 25.98 | 26.80 | 27.48 | 28.30 |
| Fibonacci | 24.45 | 25.02 | 25.38 | 25.95 | 26.52 | 26.88 | 27.45 |
| Pivot points | S3 | S2 | S1 | PP | R1 | R2 | R3 |
|---|---|---|---|---|---|---|---|
| Standard | 23.90 | 25.95 | 27.30 | 29.35 | 30.70 | 32.75 | 34.10 |
| Camarilla | 27.72 | 28.03 | 28.34 | 28.65 | 28.96 | 29.27 | 29.59 |
| Woodie | 23.55 | 25.78 | 26.95 | 29.18 | 30.35 | 32.58 | 33.75 |
| Fibonacci | 25.95 | 27.25 | 28.05 | 29.35 | 30.65 | 31.45 | 32.75 |
Numerical data
The following is the status of the technical indicators and moving averages at the time of publication of this technical analysis:
| RSI (14): | 29.92 | |
| MACD (12,26,9): | -1.0200 | |
| Directional Movement: | -16.08 | |
| AROON (14): | -100.00 | |
| DEMA (21): | 25.57 | |
| Parabolic SAR (0,02-0,02-0,2): | 26.65 | |
| Elder Ray (13): | -0.80 | |
| Super Trend (3,10): | 27.25 | |
| Zig ZAG (10): | 25.20 | |
| VORTEX (21): | 0.7200 | |
| Stochastique (14,3,5): | 14.53 | |
| TEMA (21): | 24.93 | |
| Williams %R (14): | -91.18 | |
| Chande Momentum Oscillator (20): | -2.55 | |
| Repulse (5,40,3): | -2.2100 | |
| ROCnROLL: | 2 | |
| TRIX (15,9): | -0.4600 | |
| Courbe Coppock: | 20.74 |
| MA7: | 25.56 | |
| MA20: | 27.14 | |
| MA50: | 28.84 | |
| MA100: | 27.55 | |
| MAexp7: | 25.74 | |
| MAexp20: | 26.83 | |
| MAexp50: | 27.82 | |
| MAexp100: | 28.02 | |
| Price / MA7: | -1.21% | |
| Price / MA20: | -6.96% | |
| Price / MA50: | -12.45% | |
| Price / MA100: | -8.35% | |
| Price / MAexp7: | -1.90% | |
| Price / MAexp20: | -5.89% | |
| Price / MAexp50: | -9.24% | |
| Price / MAexp100: | -9.89% |
News
The last news published on SYNERGIE at the time of the generation of this analysis was as follows:
- 2019: SYNERGIE shows growth - Full-year turnover: €2,642 million (+3.6%)
- SYNERGIE: FINANCIAL SCHEDULE 2020
- SYNERGIE generates further growth - Turnover of €1,968 million over 9 months (+4%)
- Update: HALF-YEARLY RESULTS AT JUNE 30, 2019
- HALF-YEARLY RESULTS AT JUNE 30, 2018
About author

Online


Add a comment
Comments
0 comments on the analysis SYNERGIE - Daily