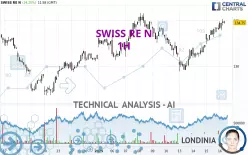
SWISS RE N - 1H - Technical analysis published on 01/16/2025 (GMT)
- 86
- 0
Click here for a new analysis!
- Timeframe : 1H
- - Analysis generated on
- Status : TARGET REACHED

Summary of the analysis

Additional analysis
Quotes
SWISS RE N rating 134.75 CHF. On the day, this instrument gained +0.56% with the lowest point at 133.90 CHF and the highest point at 135.15 CHF. The deviation from the price is +0.63% for the low point and -0.30% for the high point.A bullish gap was detected at the opening by the Central Gaps scanner. There are a lot of buyers and they have the upper hand in the very short term.
Opening Gap UP
Type : Bullish
Timeframe : Openning
So that you have an overall view of the price change, here is a table showing the variations over several periods:
Near a new HIGH record (5 years)
Type : Bullish
Timeframe : Weekly
Near a new HIGH record (1 year)
Type : Bullish
Timeframe : Weekly
Near a new LOW record (1st january)
Type : Bearish
Timeframe : Weekly
Near a new HIGH record (1 month)
Type : Bullish
Timeframe : Weekly
Technical
Technical analysis of this 1H chart of SWISS RE N indicates that the overall trend is strongly bullish. 92.86% of the signals given by moving averages are bullish. The overall trend is supported by the strong bullish signals from short-term moving averages. An assessment of moving averages reveals a bullish signal that could impact this trend:
Bullish trend reversal : Moving Average 50
Type : Bullish
Timeframe : 1 hour
The probability of a further increase is high given the direction of the technical indicators.
Caution: the Central Indicators scanner currently detects an excess:
CCI indicator is overbought : over 100
Type : Neutral
Timeframe : 1 hour
Williams %R indicator is overbought : over -20
Type : Neutral
Timeframe : 1 hour
Pivot points : price is over resistance 1
Type : Neutral
Timeframe : 1 hour
Pivot points : price is over resistance 1
Type : Neutral
Timeframe : Weekly
Central Patterns, the market scanner focusing on chart patterns, resistances and supports found this result:
Near resistance of channel
Type : Bearish
Timeframe : 1 hour
Central Candlesticks, the scanner specialised in Japanese candlesticks, detects these bearish signals that could support the hypothesis of a small drop in the very short term:
Bearish harami
Type : Bearish
Timeframe : 1 hour
Bearish harami cross
Type : Bearish
Timeframe : 1 hour
| S3 | S2 | S1 | Price | R1 | |
|---|---|---|---|---|---|
| ProTrendLines | 130.56 | 133.55 | 134.30 | 134.75 | 135.80 |
| Change (%) | -3.11% | -0.89% | -0.33% | - | +0.78% |
| Change | -4.19 | -1.20 | -0.45 | - | +1.05 |
| Level | Intermediate | Major | Intermediate | - | Minor |
Attention could also be paid to pivot points to set price objectives:
| Pivot points | S3 | S2 | S1 | PP | R1 | R2 | R3 |
|---|---|---|---|---|---|---|---|
| Standard | 130.60 | 131.50 | 132.75 | 133.65 | 134.90 | 135.80 | 137.05 |
| Camarilla | 133.41 | 133.61 | 133.80 | 134.00 | 134.20 | 134.39 | 134.59 |
| Woodie | 130.78 | 131.59 | 132.93 | 133.74 | 135.08 | 135.89 | 137.23 |
| Fibonacci | 131.50 | 132.32 | 132.83 | 133.65 | 134.47 | 134.98 | 135.80 |
| Pivot points | S3 | S2 | S1 | PP | R1 | R2 | R3 |
|---|---|---|---|---|---|---|---|
| Standard | 124.23 | 127.42 | 129.43 | 132.62 | 134.63 | 137.82 | 139.83 |
| Camarilla | 130.02 | 130.50 | 130.97 | 131.45 | 131.93 | 132.40 | 132.88 |
| Woodie | 123.65 | 127.13 | 128.85 | 132.33 | 134.05 | 137.53 | 139.25 |
| Fibonacci | 127.42 | 129.40 | 130.63 | 132.62 | 134.60 | 135.83 | 137.82 |
| Pivot points | S3 | S2 | S1 | PP | R1 | R2 | R3 |
|---|---|---|---|---|---|---|---|
| Standard | 119.73 | 123.27 | 127.23 | 130.77 | 134.73 | 138.27 | 142.23 |
| Camarilla | 129.14 | 129.83 | 130.51 | 131.20 | 131.89 | 132.58 | 133.26 |
| Woodie | 119.95 | 123.38 | 127.45 | 130.88 | 134.95 | 138.38 | 142.45 |
| Fibonacci | 123.27 | 126.13 | 127.90 | 130.77 | 133.63 | 135.40 | 138.27 |
Numerical data
The following is the status of the technical indicators and moving averages at the time of publication of this technical analysis:
| RSI (14): | 72.30 | |
| MACD (12,26,9): | 0.7400 | |
| Directional Movement: | 19.85 | |
| AROON (14): | 100.00 | |
| DEMA (21): | 134.16 | |
| Parabolic SAR (0,02-0,02-0,2): | 133.90 | |
| Elder Ray (13): | 1.05 | |
| Super Trend (3,10): | 133.02 | |
| Zig ZAG (10): | 134.90 | |
| VORTEX (21): | 1.3000 | |
| Stochastique (14,3,5): | 92.14 | |
| TEMA (21): | 135.00 | |
| Williams %R (14): | -10.94 | |
| Chande Momentum Oscillator (20): | 1.85 | |
| Repulse (5,40,3): | 0.1500 | |
| ROCnROLL: | 1 | |
| TRIX (15,9): | 0.0600 | |
| Courbe Coppock: | 3.88 |
| MA7: | 133.09 | |
| MA20: | 131.92 | |
| MA50: | 127.37 | |
| MA100: | 121.32 | |
| MAexp7: | 134.37 | |
| MAexp20: | 133.33 | |
| MAexp50: | 132.71 | |
| MAexp100: | 132.30 | |
| Price / MA7: | +1.25% | |
| Price / MA20: | +2.15% | |
| Price / MA50: | +5.79% | |
| Price / MA100: | +11.07% | |
| Price / MAexp7: | +0.28% | |
| Price / MAexp20: | +1.07% | |
| Price / MAexp50: | +1.54% | |
| Price / MAexp100: | +1.85% |
News
Don't forget to follow the news on SWISS RE N. At the time of publication of this analysis, the latest news was as follows:
- Swiss Re proposes new members for election to the Board of Directors
- Swiss Re targets a net income of more than USD 4.4 billion for 2025
- Hurricanes, severe thunderstorms and floods drive insured losses above USD 100 billion for 5th consecutive year, says Swiss Re Institute
- Life insurance drives global premium growth as interest rates remain higher for longer, says Swiss Re Institute
- Swiss Re reports a net income of USD 2.2 billion for the first nine months of 2024
About author
Online


Add a comment
Comments
0 comments on the analysis SWISS RE N - 1H