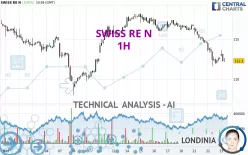
SWISS RE N - 1H - Technical analysis published on 10/23/2024 (GMT)
- 104
- 0
Click here for a new analysis!
- Timeframe : 1H
- - Analysis generated on
- Status : LEVEL MAINTAINED

Summary of the analysis

Additional analysis
Quotes
SWISS RE N rating 112.30 CHF. On the day, this instrument lost -0.31% and was traded between 112.20 CHF and 113.60 CHF over the period. The price is currently at +0.09% from its lowest and -1.14% from its highest.A bullish opening was detected by the Central Gaps scanner. Buyers are trying to impose a bullish momentum in the very short term.
Bullish opening
Type : Bullish
Timeframe : Openning
A study of price movements over other periods shows the following variations:
Near a new HIGH record (5 years)
Type : Bullish
Timeframe : Weekly
Near a new HIGH record (1 year)
Type : Bullish
Timeframe : Weekly
Near a new HIGH record (1st january)
Type : Bullish
Timeframe : Weekly
Near a new HIGH record (1 month)
Type : Bullish
Timeframe : Weekly
Technical
A technical analysis in 1H of this SWISS RE N chart shows a bearish trend. 78.57% of the signals given by moving averages are bearish. The overall trend is reinforced by the strong bearish signals from short-term moving averages. There is no crossing of moving average by the price or crossing of moving averages between themselves.
An assessment of technical indicators does not currently provide any relevant information on the direction of future price movements.
Caution: the Central Indicators scanner currently detects an excess:
MACD indicator: bullish divergence
Type : Bullish
Timeframe : 1 hour
Pivot points : price is under support 3
Type : Neutral
Timeframe : Weekly
The Central Patterns scanner, which studies chart patterns, resistances and supports, has identified this signal:
Near support of channel
Type : Bullish
Timeframe : 1 hour
The Central Candlesticks scanner which studies Japanese candlesticks did not detect anything.
| S3 | S2 | S1 | Price | R1 | R2 | R3 | |
|---|---|---|---|---|---|---|---|
| ProTrendLines | 108.04 | 110.30 | 111.60 | 112.30 | 113.35 | 114.62 | 116.75 |
| Change (%) | -3.79% | -1.78% | -0.62% | - | +0.93% | +2.07% | +3.96% |
| Change | -4.26 | -2.00 | -0.70 | - | +1.05 | +2.32 | +4.45 |
| Level | Major | Major | Minor | - | Minor | Minor | Major |
Attention could also be paid to pivot points to set price objectives:
| Pivot points | S3 | S2 | S1 | PP | R1 | R2 | R3 |
|---|---|---|---|---|---|---|---|
| Standard | 108.23 | 109.92 | 111.28 | 112.97 | 114.33 | 116.02 | 117.38 |
| Camarilla | 111.81 | 112.09 | 112.37 | 112.65 | 112.93 | 113.21 | 113.49 |
| Woodie | 108.08 | 109.84 | 111.13 | 112.89 | 114.18 | 115.94 | 117.23 |
| Fibonacci | 109.92 | 111.08 | 111.80 | 112.97 | 114.13 | 114.85 | 116.02 |
| Pivot points | S3 | S2 | S1 | PP | R1 | R2 | R3 |
|---|---|---|---|---|---|---|---|
| Standard | 113.47 | 114.73 | 115.77 | 117.03 | 118.07 | 119.33 | 120.37 |
| Camarilla | 116.17 | 116.38 | 116.59 | 116.80 | 117.01 | 117.22 | 117.43 |
| Woodie | 113.35 | 114.68 | 115.65 | 116.98 | 117.95 | 119.28 | 120.25 |
| Fibonacci | 114.73 | 115.61 | 116.16 | 117.03 | 117.91 | 118.46 | 119.33 |
| Pivot points | S3 | S2 | S1 | PP | R1 | R2 | R3 |
|---|---|---|---|---|---|---|---|
| Standard | 109.70 | 112.00 | 114.35 | 116.65 | 119.00 | 121.30 | 123.65 |
| Camarilla | 115.42 | 115.85 | 116.27 | 116.70 | 117.13 | 117.55 | 117.98 |
| Woodie | 109.73 | 112.01 | 114.38 | 116.66 | 119.03 | 121.31 | 123.68 |
| Fibonacci | 112.00 | 113.78 | 114.87 | 116.65 | 118.43 | 119.52 | 121.30 |
Numerical data
The following are the details of the technical indicators and moving averages that were collected to generate this technical analysis:
| RSI (14): | 33.70 | |
| MACD (12,26,9): | -0.9700 | |
| Directional Movement: | -24.50 | |
| AROON (14): | -42.86 | |
| DEMA (21): | 112.35 | |
| Parabolic SAR (0,02-0,02-0,2): | 111.78 | |
| Elder Ray (13): | -0.72 | |
| Super Trend (3,10): | 114.10 | |
| Zig ZAG (10): | 112.40 | |
| VORTEX (21): | 0.6500 | |
| Stochastique (14,3,5): | 29.03 | |
| TEMA (21): | 111.90 | |
| Williams %R (14): | -71.21 | |
| Chande Momentum Oscillator (20): | -2.10 | |
| Repulse (5,40,3): | -0.3500 | |
| ROCnROLL: | 2 | |
| TRIX (15,9): | -0.1200 | |
| Courbe Coppock: | 4.45 |
| MA7: | 115.36 | |
| MA20: | 115.07 | |
| MA50: | 115.07 | |
| MA100: | 111.94 | |
| MAexp7: | 112.67 | |
| MAexp20: | 113.61 | |
| MAexp50: | 114.78 | |
| MAexp100: | 115.13 | |
| Price / MA7: | -2.65% | |
| Price / MA20: | -2.41% | |
| Price / MA50: | -2.41% | |
| Price / MA100: | +0.32% | |
| Price / MAexp7: | -0.33% | |
| Price / MAexp20: | -1.15% | |
| Price / MAexp50: | -2.16% | |
| Price / MAexp100: | -2.46% |
News
Don't forget to follow the news on SWISS RE N. At the time of publication of this analysis, the latest news was as follows:
- Covid-19 may lead to longest period of peacetime excess mortality, says new Swiss Re report
- Swiss Re sees increasing demand for reinsurance in volatile environment
- Litigation costs drive US liability claims by 57% over past decade, reveals Swiss Re Institute
- Swiss Re reports a net income of USD 2.1 billion for the first half of 2024
- Severe thunderstorms drive insured losses to USD 60 billion in first half of 2024, Swiss Re Institute estimates
About author
Online


Add a comment
Comments
0 comments on the analysis SWISS RE N - 1H