SWISS RE N - Daily - Technical analysis published on 10/15/2024 (GMT)
- 121
- 0
Click here for a new analysis!
- Timeframe : Daily
- - Analysis generated on
- Status : INVALID

Summary of the analysis

Additional analysis
Quotes
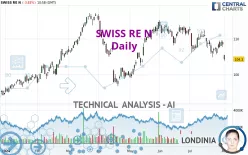
The SWISS RE N price is 117.95 CHF. The price registered a decrease of -0.17% on the session and was between 117.10 CHF and 118.30 CHF. This implies that the price is at +0.73% from its lowest and at -0.30% from its highest.Here is a more detailed summary of the historical variations registered by SWISS RE N:
Near a new HIGH record (5 years)
Type : Bullish
Timeframe : Weekly
Near a new HIGH record (1 year)
Type : Bullish
Timeframe : Weekly
Near a new HIGH record (1st january)
Type : Bullish
Timeframe : Weekly
Near a new HIGH record (1 month)
Type : Bullish
Timeframe : Weekly
Technical
Technical analysis of SWISS RE N in Daily shows a strongly overall bullish trend. 92.86% of the signals given by moving averages are bullish. The overall trend is supported by the strong bullish signals from short-term moving averages. The Central Indicators scanner does not detect any result on moving averages that would impact this trend.
In fact, 13 technical indicators on 18 studied are currently positioned bullish. Caution: the Central Indicators scanner currently detects an excess:
CCI indicator is overbought : over 100
Type : Neutral
Timeframe : Daily
Williams %R indicator is overbought : over -20
Type : Neutral
Timeframe : Daily
Central Patterns, the market scanner focusing on chart patterns, resistances and supports found these results:
Near resistance of channel
Type : Bearish
Timeframe : Daily
Near horizontal support
Type : Bullish
Timeframe : Daily
No result was found by the Central Candlesticks scanner on Japanese candlesticks.
| S3 | S2 | S1 | Price | |
|---|---|---|---|---|
| ProTrendLines | 108.04 | 114.57 | 116.75 | 117.95 |
| Change (%) | -8.40% | -2.87% | -1.02% | - |
| Change | -9.91 | -3.38 | -1.20 | - |
| Level | Major | Major | Major | - |
To determine price objectives, it is also possible to use the pivot points. Here is the price position in relation to pivot points:
| Pivot points | S3 | S2 | S1 | PP | R1 | R2 | R3 |
|---|---|---|---|---|---|---|---|
| Standard | 115.42 | 115.98 | 117.07 | 117.63 | 118.72 | 119.28 | 120.37 |
| Camarilla | 117.70 | 117.85 | 118.00 | 118.15 | 118.30 | 118.45 | 118.60 |
| Woodie | 115.68 | 116.11 | 117.33 | 117.76 | 118.98 | 119.41 | 120.63 |
| Fibonacci | 115.98 | 116.61 | 117.00 | 117.63 | 118.26 | 118.65 | 119.28 |
| Pivot points | S3 | S2 | S1 | PP | R1 | R2 | R3 |
|---|---|---|---|---|---|---|---|
| Standard | 101.75 | 104.85 | 110.65 | 113.75 | 119.55 | 122.65 | 128.45 |
| Camarilla | 114.00 | 114.82 | 115.63 | 116.45 | 117.27 | 118.08 | 118.90 |
| Woodie | 103.10 | 105.53 | 112.00 | 114.43 | 120.90 | 123.33 | 129.80 |
| Fibonacci | 104.85 | 108.25 | 110.35 | 113.75 | 117.15 | 119.25 | 122.65 |
| Pivot points | S3 | S2 | S1 | PP | R1 | R2 | R3 |
|---|---|---|---|---|---|---|---|
| Standard | 109.70 | 112.00 | 114.35 | 116.65 | 119.00 | 121.30 | 123.65 |
| Camarilla | 115.42 | 115.85 | 116.27 | 116.70 | 117.13 | 117.55 | 117.98 |
| Woodie | 109.73 | 112.01 | 114.38 | 116.66 | 119.03 | 121.31 | 123.68 |
| Fibonacci | 112.00 | 113.78 | 114.87 | 116.65 | 118.43 | 119.52 | 121.30 |
Numerical data
The following are the details of the technical indicators and moving averages that were collected to generate this technical analysis:
| RSI (14): | 57.77 | |
| MACD (12,26,9): | 0.4000 | |
| Directional Movement: | 6.07 | |
| AROON (14): | -64.29 | |
| DEMA (21): | 115.80 | |
| Parabolic SAR (0,02-0,02-0,2): | 109.06 | |
| Elder Ray (13): | 2.28 | |
| Super Trend (3,10): | 111.14 | |
| Zig ZAG (10): | 117.55 | |
| VORTEX (21): | 1.0200 | |
| Stochastique (14,3,5): | 86.33 | |
| TEMA (21): | 115.42 | |
| Williams %R (14): | -11.01 | |
| Chande Momentum Oscillator (20): | 0.15 | |
| Repulse (5,40,3): | 2.1400 | |
| ROCnROLL: | 1 | |
| TRIX (15,9): | 0.0300 | |
| Courbe Coppock: | 2.62 |
| MA7: | 114.46 | |
| MA20: | 115.49 | |
| MA50: | 113.75 | |
| MA100: | 111.81 | |
| MAexp7: | 115.93 | |
| MAexp20: | 115.24 | |
| MAexp50: | 113.91 | |
| MAexp100: | 111.81 | |
| Price / MA7: | +3.05% | |
| Price / MA20: | +2.13% | |
| Price / MA50: | +3.69% | |
| Price / MA100: | +5.49% | |
| Price / MAexp7: | +1.74% | |
| Price / MAexp20: | +2.35% | |
| Price / MAexp50: | +3.55% | |
| Price / MAexp100: | +5.49% |
News
The latest news and videos published on SWISS RE N at the time of the analysis were as follows:
- Covid-19 may lead to longest period of peacetime excess mortality, says new Swiss Re report
- Swiss Re sees increasing demand for reinsurance in volatile environment
- Litigation costs drive US liability claims by 57% over past decade, reveals Swiss Re Institute
- Swiss Re reports a net income of USD 2.1 billion for the first half of 2024
- Severe thunderstorms drive insured losses to USD 60 billion in first half of 2024, Swiss Re Institute estimates
About author
Online


Add a comment
Comments
0 comments on the analysis SWISS RE N - Daily