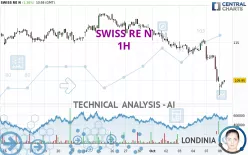
SWISS RE N - 1H - Technical analysis published on 10/08/2024 (GMT)
- 121
- 0
Click here for a new analysis!
- Timeframe : 1H
- - Analysis generated on
- Status : INVALID

Summary of the analysis

Additional analysis
Quotes
The SWISS RE N price is 109.95 CHF. On the day, this instrument lost -0.32% with the lowest point at 107.95 CHF and the highest point at 110.00 CHF. The deviation from the price is +1.85% for the low point and -0.05% for the high point.The Central Gaps scanner detects the formation of a bearish gap marking the strong presence of sellers ahead of buyers at the opening. This formed a quotation gap.
Opening Gap DOWN
Type : Bearish
Timeframe : Openning
So that you have an overall view of the price change, here is a table showing the variations over several periods:
Near a new HIGH record (5 years)
Type : Bullish
Timeframe : Weekly
New LOW record (1 month)
Type : Bearish
Timeframe : Weekly
Technical
Technical analysis of this 1H chart of SWISS RE N indicates that the overall trend is strongly bearish. 92.86% of the signals given by moving averages are bearish. The overall trend is supported by the strong bearish signals from short-term moving averages. The Central Indicators scanner does not detect any result on moving averages that would impact this trend.
An assessment of technical indicators does not currently provide any relevant information on the direction of future price movements.
But beware of excesses. The Central Indicators scanner currently detects this:
RSI indicator is oversold : under 30
Type : Neutral
Timeframe : 1 hour
CCI indicator is oversold : under -100
Type : Neutral
Timeframe : 1 hour
Pivot points : price is under support 3
Type : Neutral
Timeframe : Weekly
Central Patterns, the market scanner focusing on chart patterns, resistances and supports found this result:
Near support of channel
Type : Bullish
Timeframe : 1 hour
No result was found by the Central Candlesticks scanner on Japanese candlesticks.
| S3 | S2 | S1 | Price | R1 | R2 | R3 | |
|---|---|---|---|---|---|---|---|
| ProTrendLines | 99.14 | 103.50 | 108.04 | 109.95 | 110.90 | 113.35 | 114.57 |
| Change (%) | -9.83% | -5.87% | -1.74% | - | +0.86% | +3.09% | +4.20% |
| Change | -10.81 | -6.45 | -1.91 | - | +0.95 | +3.40 | +4.62 |
| Level | Major | Minor | Major | - | Minor | Minor | Intermediate |
Attention could also be paid to pivot points to set price objectives:
| Pivot points | S3 | S2 | S1 | PP | R1 | R2 | R3 |
|---|---|---|---|---|---|---|---|
| Standard | 103.70 | 106.70 | 108.50 | 111.50 | 113.30 | 116.30 | 118.10 |
| Camarilla | 108.98 | 109.42 | 109.86 | 110.30 | 110.74 | 111.18 | 111.62 |
| Woodie | 103.10 | 106.40 | 107.90 | 111.20 | 112.70 | 116.00 | 117.50 |
| Fibonacci | 106.70 | 108.53 | 109.67 | 111.50 | 113.33 | 114.47 | 116.30 |
| Pivot points | S3 | S2 | S1 | PP | R1 | R2 | R3 |
|---|---|---|---|---|---|---|---|
| Standard | 108.68 | 111.02 | 112.93 | 115.27 | 117.18 | 119.52 | 121.43 |
| Camarilla | 113.68 | 114.07 | 114.46 | 114.85 | 115.24 | 115.63 | 116.02 |
| Woodie | 108.48 | 110.91 | 112.73 | 115.16 | 116.98 | 119.41 | 121.23 |
| Fibonacci | 111.02 | 112.64 | 113.64 | 115.27 | 116.89 | 117.89 | 119.52 |
| Pivot points | S3 | S2 | S1 | PP | R1 | R2 | R3 |
|---|---|---|---|---|---|---|---|
| Standard | 109.70 | 112.00 | 114.35 | 116.65 | 119.00 | 121.30 | 123.65 |
| Camarilla | 115.42 | 115.85 | 116.27 | 116.70 | 117.13 | 117.55 | 117.98 |
| Woodie | 109.73 | 112.01 | 114.38 | 116.66 | 119.03 | 121.31 | 123.68 |
| Fibonacci | 112.00 | 113.78 | 114.87 | 116.65 | 118.43 | 119.52 | 121.30 |
Numerical data
The following is the status of technical indicators and moving averages registered at the time this technical analysis was created:
| RSI (14): | 26.39 | |
| MACD (12,26,9): | -1.3500 | |
| Directional Movement: | -35.74 | |
| AROON (14): | -78.57 | |
| DEMA (21): | 110.50 | |
| Parabolic SAR (0,02-0,02-0,2): | 113.38 | |
| Elder Ray (13): | -1.74 | |
| Super Trend (3,10): | 111.76 | |
| Zig ZAG (10): | 109.75 | |
| VORTEX (21): | 0.7600 | |
| Stochastique (14,3,5): | 19.33 | |
| TEMA (21): | 109.79 | |
| Williams %R (14): | -76.00 | |
| Chande Momentum Oscillator (20): | -5.10 | |
| Repulse (5,40,3): | 0.1800 | |
| ROCnROLL: | 2 | |
| TRIX (15,9): | -0.1100 | |
| Courbe Coppock: | 6.88 |
| MA7: | 113.60 | |
| MA20: | 115.33 | |
| MA50: | 112.54 | |
| MA100: | 111.57 | |
| MAexp7: | 110.21 | |
| MAexp20: | 112.08 | |
| MAexp50: | 113.75 | |
| MAexp100: | 114.84 | |
| Price / MA7: | -3.21% | |
| Price / MA20: | -4.66% | |
| Price / MA50: | -2.30% | |
| Price / MA100: | -1.45% | |
| Price / MAexp7: | -0.24% | |
| Price / MAexp20: | -1.90% | |
| Price / MAexp50: | -3.34% | |
| Price / MAexp100: | -4.26% |
News
The last news published on SWISS RE N at the time of the generation of this analysis was as follows:
- Covid-19 may lead to longest period of peacetime excess mortality, says new Swiss Re report
- Swiss Re sees increasing demand for reinsurance in volatile environment
- Litigation costs drive US liability claims by 57% over past decade, reveals Swiss Re Institute
- Swiss Re reports a net income of USD 2.1 billion for the first half of 2024
- Severe thunderstorms drive insured losses to USD 60 billion in first half of 2024, Swiss Re Institute estimates
About author
Online


Add a comment
Comments
0 comments on the analysis SWISS RE N - 1H