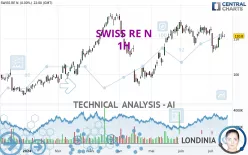
SWISS RE N - 1H - Technical analysis published on 07/15/2024 (GMT)
- 121
- 0
Click here for a new analysis!
- Timeframe : 1H
- - Analysis generated on
- Status : INVALID

Summary of the analysis

Additional analysis
Quotes
SWISS RE N rating 112.00 CHF. On the day, this instrument gained +1.08% and was traded between 110.80 CHF and 112.30 CHF over the period. The price is currently at +1.08% from its lowest and -0.27% from its highest.The Central Gaps scanner detects a bullish opening marking the presence of buyers ahead of sellers at the opening but not sufficiently marked to allow the price to register a quotation gap.
Bullish opening
Type : Bullish
Timeframe : Openning
Here is a more detailed summary of the historical variations registered by SWISS RE N:
Near a new HIGH record (5 years)
Type : Bullish
Timeframe : Weekly
Near a new HIGH record (1 year)
Type : Bullish
Timeframe : Weekly
Near a new HIGH record (1st january)
Type : Bullish
Timeframe : Weekly
Near a new LOW record (1 month)
Type : Bearish
Timeframe : Weekly
Technical
Technical analysis of this 1H chart of SWISS RE N indicates that the overall trend is strongly bullish. 82.14% of the signals given by moving averages are bullish. This strongly bullish trend is supported by the strong bullish signals given by short-term moving averages. There is no crossing of moving average by the price or crossing of moving averages between themselves.
In fact, 15 technical indicators on 18 studied are currently bullish. Caution: the Central Indicators scanner currently detects an excess:
CCI indicator is overbought : over 100
Type : Neutral
Timeframe : 1 hour
Williams %R indicator is overbought : over -20
Type : Neutral
Timeframe : 1 hour
Pivot points : price is over resistance 2
Type : Neutral
Timeframe : 1 hour
Central Patterns, the market scanner focusing on chart patterns, resistances and supports found these results:
Near horizontal resistance
Type : Bearish
Timeframe : 1 hour
Near resistance of triangle
Type : Bearish
Timeframe : 1 hour
Resistance of channel is broken
Type : Bullish
Timeframe : 1 hour
The Central Candlesticks scanner, specialised in Japanese candlesticks, did not identify any signals.
| S3 | S2 | S1 | Price | R1 | R2 | R3 | |
|---|---|---|---|---|---|---|---|
| ProTrendLines | 107.33 | 108.04 | 110.96 | 112.00 | 112.40 | 113.34 | 114.70 |
| Change (%) | -4.17% | -3.54% | -0.93% | - | +0.36% | +1.20% | +2.41% |
| Change | -4.67 | -3.96 | -1.04 | - | +0.40 | +1.34 | +2.70 |
| Level | Intermediate | Major | Major | - | Major | Intermediate | Intermediate |
To determine price objectives, it is also possible to use the pivot points. Here is the price position in relation to pivot points:
| Pivot points | S3 | S2 | S1 | PP | R1 | R2 | R3 |
|---|---|---|---|---|---|---|---|
| Standard | 109.53 | 109.97 | 110.38 | 110.82 | 111.23 | 111.67 | 112.08 |
| Camarilla | 110.57 | 110.64 | 110.72 | 110.80 | 110.88 | 110.96 | 111.03 |
| Woodie | 109.53 | 109.96 | 110.38 | 110.81 | 111.23 | 111.66 | 112.08 |
| Fibonacci | 109.97 | 110.29 | 110.49 | 110.82 | 111.14 | 111.34 | 111.67 |
| Pivot points | S3 | S2 | S1 | PP | R1 | R2 | R3 |
|---|---|---|---|---|---|---|---|
| Standard | 103.57 | 105.53 | 108.17 | 110.13 | 112.77 | 114.73 | 117.37 |
| Camarilla | 109.54 | 109.96 | 110.38 | 110.80 | 111.22 | 111.64 | 112.07 |
| Woodie | 103.90 | 105.70 | 108.50 | 110.30 | 113.10 | 114.90 | 117.70 |
| Fibonacci | 105.53 | 107.29 | 108.38 | 110.13 | 111.89 | 112.98 | 114.73 |
| Pivot points | S3 | S2 | S1 | PP | R1 | R2 | R3 |
|---|---|---|---|---|---|---|---|
| Standard | 101.07 | 104.63 | 108.07 | 111.63 | 115.07 | 118.63 | 122.07 |
| Camarilla | 109.58 | 110.22 | 110.86 | 111.50 | 112.14 | 112.78 | 113.43 |
| Woodie | 101.00 | 104.60 | 108.00 | 111.60 | 115.00 | 118.60 | 122.00 |
| Fibonacci | 104.63 | 107.31 | 108.96 | 111.63 | 114.31 | 115.96 | 118.63 |
Numerical data
The following are the details of the technical indicators and moving averages that were collected to generate this technical analysis:
| RSI (14): | 67.04 | |
| MACD (12,26,9): | 0.3700 | |
| Directional Movement: | 21.90 | |
| AROON (14): | 92.86 | |
| DEMA (21): | 111.58 | |
| Parabolic SAR (0,02-0,02-0,2): | 110.51 | |
| Elder Ray (13): | 0.75 | |
| Super Trend (3,10): | 110.69 | |
| Zig ZAG (10): | 112.10 | |
| VORTEX (21): | 1.1500 | |
| Stochastique (14,3,5): | 87.65 | |
| TEMA (21): | 111.65 | |
| Williams %R (14): | -13.16 | |
| Chande Momentum Oscillator (20): | 1.55 | |
| Repulse (5,40,3): | 0.3100 | |
| ROCnROLL: | 1 | |
| TRIX (15,9): | 0.0300 | |
| Courbe Coppock: | 1.16 |
| MA7: | 110.29 | |
| MA20: | 110.79 | |
| MA50: | 109.95 | |
| MA100: | 108.62 | |
| MAexp7: | 111.59 | |
| MAexp20: | 111.14 | |
| MAexp50: | 110.57 | |
| MAexp100: | 110.37 | |
| Price / MA7: | +1.55% | |
| Price / MA20: | +1.09% | |
| Price / MA50: | +1.86% | |
| Price / MA100: | +3.11% | |
| Price / MAexp7: | +0.37% | |
| Price / MAexp20: | +0.77% | |
| Price / MAexp50: | +1.29% | |
| Price / MAexp100: | +1.48% |
News
The latest news and videos published on SWISS RE N at the time of the analysis were as follows:
- Beyond broken infrastructure – Swiss Re explores cascading effects of natural disasters and other key emerging risks
- Life insurance set to boom as interest rates surge, says Swiss Re Institute
- Swiss Re announces changes to the Group Executive Committee
- Swiss Re reports a first-quarter IFRS net income of USD 1.1 billion
- Swiss Re launches Swiss Re Life Guide Scout, a Generative AI-powered underwriting assistant
About author
Online


Add a comment
Comments
0 comments on the analysis SWISS RE N - 1H