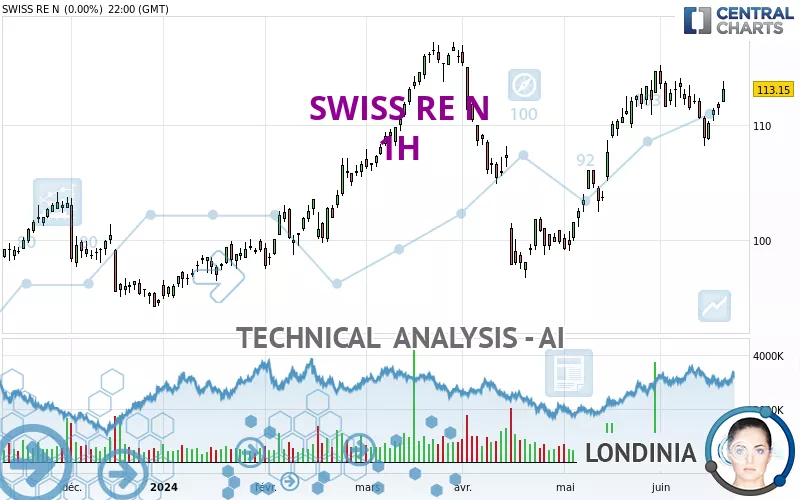
SWISS RE N - 1H - Technical analysis published on 06/21/2024 (GMT)
- 129
- 0
Click here for a new analysis!
- Timeframe : 1H
- - Analysis generated on
- Status : LEVEL MAINTAINED
Summary of the analysis

Additional analysis
Quotes
The SWISS RE N rating is 112.65 CHF. The price registered a decrease of -0.44% on the session and was traded between 111.60 CHF and 113.30 CHF over the period. The price is currently at +0.94% from its lowest and -0.57% from its highest.A bearish opening was detected by the Central Gaps scanner. Sellers are trying to impose a bearish trend in the very short term.
Bearish opening
Type : Bearish
Timeframe : Openning
A study of price movements over other periods shows the following variations:
Near a new HIGH record (5 years)
Type : Bullish
Timeframe : Weekly
Near a new HIGH record (1 year)
Type : Bullish
Timeframe : Weekly
Near a new HIGH record (1st january)
Type : Bullish
Timeframe : Weekly
Near a new LOW record (1 month)
Type : Bearish
Timeframe : Weekly
Technical
Technical analysis of this 1H chart of SWISS RE N indicates that the overall trend is bullish. 78.57% of the signals given by moving averages are bullish. The overall trend is reinforced by the strong bullish signals from short-term moving averages. The Central Indicators market scanner is currently detecting several bullish signals that could impact this trend:
Bullish trend reversal : adaptative moving average 20
Type : Bullish
Timeframe : 1 hour
Bullish price crossover with Moving Average 20
Type : Bullish
Timeframe : 1 hour
Bullish price crossover with adaptative moving average 20
Type : Bullish
Timeframe : 1 hour
The technical indicators are generally neutral. They do not provide relevant information on the direction of future price movements.
Central Indicators, the scanner specialised in technical indicators, has identified this signal:
Pivot points : price is over resistance 1
Type : Neutral
Timeframe : Weekly
The Central Patterns scanner, which studies chart patterns, resistances and supports, has identified these signals:
Near horizontal support
Type : Bullish
Timeframe : 1 hour
Support of channel is broken
Type : Bearish
Timeframe : 1 hour
Central Candlesticks, the scanner specialised in Japanese candlesticks, detects these signals that could have an impact on the current short-term trend:
Upside gap
Type : Bullish
Timeframe : 1 hour
Bearish doji star
Type : Bearish
Timeframe : 1 hour
| S3 | S2 | S1 | Price | R1 | R2 | R3 | |
|---|---|---|---|---|---|---|---|
| ProTrendLines | 109.75 | 111.55 | 112.52 | 112.65 | 113.20 | 113.86 | 114.70 |
| Change (%) | -2.57% | -0.98% | -0.12% | - | +0.49% | +1.07% | +1.82% |
| Change | -2.90 | -1.10 | -0.13 | - | +0.55 | +1.21 | +2.05 |
| Level | Minor | Major | Minor | - | Minor | Major | Intermediate |
Pivot points can also be used to set your price objectives. Here is the price situation in relation to pivot points:
| Pivot points | S3 | S2 | S1 | PP | R1 | R2 | R3 |
|---|---|---|---|---|---|---|---|
| Standard | 110.22 | 111.08 | 112.12 | 112.98 | 114.02 | 114.88 | 115.92 |
| Camarilla | 112.63 | 112.80 | 112.98 | 113.15 | 113.32 | 113.50 | 113.67 |
| Woodie | 110.30 | 111.13 | 112.20 | 113.03 | 114.10 | 114.93 | 116.00 |
| Fibonacci | 111.08 | 111.81 | 112.26 | 112.98 | 113.71 | 114.16 | 114.88 |
| Pivot points | S3 | S2 | S1 | PP | R1 | R2 | R3 |
|---|---|---|---|---|---|---|---|
| Standard | 101.60 | 104.90 | 106.90 | 110.20 | 112.20 | 115.50 | 117.50 |
| Camarilla | 107.44 | 107.93 | 108.41 | 108.90 | 109.39 | 109.87 | 110.36 |
| Woodie | 100.95 | 104.58 | 106.25 | 109.88 | 111.55 | 115.18 | 116.85 |
| Fibonacci | 104.90 | 106.93 | 108.18 | 110.20 | 112.23 | 113.48 | 115.50 |
| Pivot points | S3 | S2 | S1 | PP | R1 | R2 | R3 |
|---|---|---|---|---|---|---|---|
| Standard | 88.60 | 93.82 | 104.26 | 109.48 | 119.92 | 125.14 | 135.58 |
| Camarilla | 110.39 | 111.83 | 113.27 | 114.70 | 116.14 | 117.57 | 119.01 |
| Woodie | 91.21 | 95.13 | 106.87 | 110.79 | 122.53 | 126.45 | 138.19 |
| Fibonacci | 93.82 | 99.80 | 103.50 | 109.48 | 115.46 | 119.16 | 125.14 |
Numerical data
The following is the status of technical indicators and moving averages registered at the time this technical analysis was created:
| RSI (14): | 55.91 | |
| MACD (12,26,9): | 0.2600 | |
| Directional Movement: | 9.21 | |
| AROON (14): | -78.57 | |
| DEMA (21): | 112.54 | |
| Parabolic SAR (0,02-0,02-0,2): | 111.63 | |
| Elder Ray (13): | 0.15 | |
| Super Trend (3,10): | 111.64 | |
| Zig ZAG (10): | 112.40 | |
| VORTEX (21): | 1.0500 | |
| Stochastique (14,3,5): | 32.06 | |
| TEMA (21): | 112.49 | |
| Williams %R (14): | -52.78 | |
| Chande Momentum Oscillator (20): | -0.55 | |
| Repulse (5,40,3): | 0.2800 | |
| ROCnROLL: | 1 | |
| TRIX (15,9): | 0.0500 | |
| Courbe Coppock: | 0.12 |
| MA7: | 111.14 | |
| MA20: | 112.15 | |
| MA50: | 106.95 | |
| MA100: | 107.03 | |
| MAexp7: | 112.27 | |
| MAexp20: | 112.14 | |
| MAexp50: | 111.68 | |
| MAexp100: | 111.54 | |
| Price / MA7: | +1.36% | |
| Price / MA20: | +0.45% | |
| Price / MA50: | +5.33% | |
| Price / MA100: | +5.25% | |
| Price / MAexp7: | +0.34% | |
| Price / MAexp20: | +0.45% | |
| Price / MAexp50: | +0.87% | |
| Price / MAexp100: | +1.00% |
News
The latest news and videos published on SWISS RE N at the time of the analysis were as follows:
- Beyond broken infrastructure – Swiss Re explores cascading effects of natural disasters and other key emerging risks
- Life insurance set to boom as interest rates surge, says Swiss Re Institute
- Swiss Re announces changes to the Group Executive Committee
- Swiss Re reports a first-quarter IFRS net income of USD 1.1 billion
- Swiss Re launches Swiss Re Life Guide Scout, a Generative AI-powered underwriting assistant
About author
Online


Add a comment
Comments
0 comments on the analysis SWISS RE N - 1H