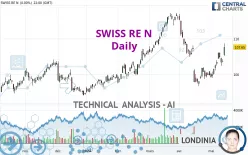
SWISS RE N - Daily - Technical analysis published on 05/17/2024 (GMT)
- 129
- 0
Click here for a new analysis!
- Timeframe : Daily
- - Analysis generated on
- Status : LEVEL MAINTAINED

Summary of the analysis

Additional analysis
Quotes
The SWISS RE N rating is 109.60 CHF. On the day, this instrument gained +1.81% and was between 108.85 CHF and 110.30 CHF. This implies that the price is at +0.69% from its lowest and at -0.63% from its highest.The Central Gaps scanner detects a bullish gap which is a sign that buyers have taken the lead in the very short term.
Opening Gap UP
Type : Bullish
Timeframe : Openning
A study of price movements over other periods shows the following variations:
New HIGH record (1 month)
Type : Bullish
Timeframe : Weekly
Technical
Technical analysis of this Daily chart of SWISS RE N indicates that the overall trend is strongly bullish. The signals given by the moving averages are 82.14% bullish. This strong bullish trend is confirmed by the strong signals currently being given by short-term moving averages. An assessment of moving averages reveals several bullish signals that could impact this trend:
Bullish trend reversal : Moving Average 20
Type : Bullish
Timeframe : Daily
Bullish trend reversal : Moving Average 50
Type : Bullish
Timeframe : Daily
Bullish trend reversal : adaptative moving average 50
Type : Bullish
Timeframe : Daily
An assessment of technical indicators shows a strong bullish signal.
Caution: the Central Indicators scanner currently detects an excess:
CCI indicator is overbought : over 100
Type : Neutral
Timeframe : Daily
Williams %R indicator is overbought : over -20
Type : Neutral
Timeframe : Daily
Pivot points : price is over resistance 1
Type : Neutral
Timeframe : Daily
Pivot points : price is over resistance 1
Type : Neutral
Timeframe : Weekly
MACD indicator is back over 0
Type : Bullish
Timeframe : Daily
Central Patterns, the market scanner focusing on chart patterns, resistances and supports found these results:
Near horizontal resistance
Type : Bearish
Timeframe : Daily
Resistance of channel is broken
Type : Bullish
Timeframe : Daily
Central Candlesticks, the scanner specialised in Japanese candlesticks, detects a bullish signal that could support the hypothesis of a small rebound in the very short term:
Upside gap
Type : Bullish
Timeframe : Daily
| S3 | S2 | S1 | Price | R1 | |
|---|---|---|---|---|---|
| ProTrendLines | 98.98 | 103.30 | 108.04 | 109.60 | 116.75 |
| Change (%) | -9.69% | -5.75% | -1.42% | - | +6.52% |
| Change | -10.62 | -6.30 | -1.56 | - | +7.15 |
| Level | Major | Major | Major | - | Major |
Attention could also be paid to pivot points to set price objectives:
| Pivot points | S3 | S2 | S1 | PP | R1 | R2 | R3 |
|---|---|---|---|---|---|---|---|
| Standard | 102.15 | 103.65 | 105.65 | 107.15 | 109.15 | 110.65 | 112.65 |
| Camarilla | 106.69 | 107.01 | 107.33 | 107.65 | 107.97 | 108.29 | 108.61 |
| Woodie | 102.40 | 103.78 | 105.90 | 107.28 | 109.40 | 110.78 | 112.90 |
| Fibonacci | 103.65 | 104.99 | 105.81 | 107.15 | 108.49 | 109.31 | 110.65 |
| Pivot points | S3 | S2 | S1 | PP | R1 | R2 | R3 |
|---|---|---|---|---|---|---|---|
| Standard | 95.87 | 97.90 | 101.98 | 104.01 | 108.09 | 110.12 | 114.20 |
| Camarilla | 104.37 | 104.93 | 105.49 | 106.05 | 106.61 | 107.17 | 107.73 |
| Woodie | 96.89 | 98.41 | 103.00 | 104.52 | 109.11 | 110.63 | 115.22 |
| Fibonacci | 97.90 | 100.24 | 101.68 | 104.01 | 106.35 | 107.79 | 110.12 |
| Pivot points | S3 | S2 | S1 | PP | R1 | R2 | R3 |
|---|---|---|---|---|---|---|---|
| Standard | 71.88 | 84.30 | 92.06 | 104.48 | 112.24 | 124.66 | 132.42 |
| Camarilla | 94.27 | 96.12 | 97.97 | 99.82 | 101.67 | 103.52 | 105.37 |
| Woodie | 69.55 | 83.14 | 89.73 | 103.32 | 109.91 | 123.50 | 130.09 |
| Fibonacci | 84.30 | 92.01 | 96.77 | 104.48 | 112.19 | 116.95 | 124.66 |
Numerical data
The following is the status of the technical indicators and moving averages at the time of publication of this technical analysis:
| RSI (14): | 64.54 | |
| MACD (12,26,9): | 0.3200 | |
| Directional Movement: | 17.90 | |
| AROON (14): | 100.00 | |
| DEMA (21): | 103.84 | |
| Parabolic SAR (0,02-0,02-0,2): | 101.68 | |
| Elder Ray (13): | 5.21 | |
| Super Trend (3,10): | 103.00 | |
| Zig ZAG (10): | 109.60 | |
| VORTEX (21): | 1.1500 | |
| Stochastique (14,3,5): | 83.73 | |
| TEMA (21): | 105.19 | |
| Williams %R (14): | -6.22 | |
| Chande Momentum Oscillator (20): | 9.30 | |
| Repulse (5,40,3): | 1.6600 | |
| ROCnROLL: | 1 | |
| TRIX (15,9): | -0.1600 | |
| Courbe Coppock: | 11.23 |
| MA7: | 105.51 | |
| MA20: | 101.94 | |
| MA50: | 107.12 | |
| MA100: | 103.42 | |
| MAexp7: | 105.68 | |
| MAexp20: | 104.07 | |
| MAexp50: | 104.58 | |
| MAexp100: | 103.39 | |
| Price / MA7: | +3.88% | |
| Price / MA20: | +7.51% | |
| Price / MA50: | +2.32% | |
| Price / MA100: | +5.98% | |
| Price / MAexp7: | +3.71% | |
| Price / MAexp20: | +5.31% | |
| Price / MAexp50: | +4.80% | |
| Price / MAexp100: | +6.01% |
News
Don't forget to follow the news on SWISS RE N. At the time of publication of this analysis, the latest news was as follows:
- Swiss Re announces changes to the Group Executive Committee
- Swiss Re reports a first-quarter IFRS net income of USD 1.1 billion
- Swiss Re launches Swiss Re Life Guide Scout, a Generative AI-powered underwriting assistant
- Swiss Re publishes its 2023 Financial Condition Report
- Swiss Re shareholders approve all proposals at 2024 AGM
About author
Online


Add a comment
Comments
0 comments on the analysis SWISS RE N - Daily