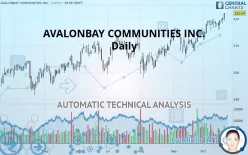
AVALONBAY COMMUNITIES INC. - Daily - Technical analysis published on 10/21/2019 (GMT)
- 283
- 0
- Who voted?
Click here for a new analysis!
- Timeframe : Daily
- - Analysis generated on
- Status : INVALID

Summary of the analysis

Additional analysis
Quotes
The AVALONBAY COMMUNITIES INC. price is 222.04 USD. On the day, this instrument gained +0.85% and was traded between 219.09 USD and 222.04 USD over the period. The price is currently at +1.35% from its lowest and 0% from its highest.The Central Gaps scanner detects a bullish opening. A small advantage for buyers in the very short term.
Bullish opening
Type : Bullish
Timeframe : Openning
Here is a more detailed summary of the historical variations registered by AVALONBAY COMMUNITIES INC.:
New HIGH record (5 years)
Type : Bullish
Timeframe : Weekly
New HIGH record (1 year)
Type : Bullish
Timeframe : Weekly
New HIGH record (1st january)
Type : Bullish
Timeframe : Weekly
New HIGH record (1 month)
Type : Bullish
Timeframe : Weekly
Technical
Technical analysis of this Daily chart of AVALONBAY COMMUNITIES INC. indicates that the overall trend is strongly bullish. 92.86% of the signals given by moving averages are bullish. This strongly bullish trend is supported by the strong bullish signals given by short-term moving averages. There is no crossing of moving average by the price or crossing of moving averages between themselves.
Technical indicators are strongly bullish, suggesting that the price increase should continue.
Caution: the Central Indicators scanner currently detects an excess:
Williams %R indicator is overbought : over -20
Type : Neutral
Timeframe : Daily
Pivot points : price is over resistance 1
Type : Neutral
Timeframe : Weekly
Pivot points : price is over resistance 2
Type : Neutral
Timeframe : Daily
The Central Patterns scanner, which studies chart patterns, resistances and supports, has identified these signals:
Near resistance of channel
Type : Bearish
Timeframe : Daily
Horizontal resistance is broken
Type : Bullish
Timeframe : Daily
The Central Candlesticks scanner which studies Japanese candlesticks did not detect anything.
| S3 | S2 | S1 | Price | |
|---|---|---|---|---|
| ProTrendLines | 213.80 | 216.16 | 219.20 | 222.04 |
| Change (%) | -3.71% | -2.65% | -1.28% | - |
| Change | -8.24 | -5.88 | -2.84 | - |
| Level | Minor | Intermediate | Intermediate | - |
Attention could also be paid to pivot points to set price objectives:
| Pivot points | S3 | S2 | S1 | PP | R1 | R2 | R3 |
|---|---|---|---|---|---|---|---|
| Standard | 216.65 | 217.44 | 218.81 | 219.60 | 220.97 | 221.76 | 223.13 |
| Camarilla | 219.58 | 219.77 | 219.97 | 220.17 | 220.37 | 220.57 | 220.76 |
| Woodie | 216.93 | 217.59 | 219.09 | 219.75 | 221.25 | 221.91 | 223.41 |
| Fibonacci | 217.44 | 218.27 | 218.78 | 219.60 | 220.43 | 220.94 | 221.76 |
| Pivot points | S3 | S2 | S1 | PP | R1 | R2 | R3 |
|---|---|---|---|---|---|---|---|
| Standard | 212.25 | 213.92 | 217.05 | 218.72 | 221.85 | 223.52 | 226.65 |
| Camarilla | 218.85 | 219.29 | 219.73 | 220.17 | 220.61 | 221.05 | 221.49 |
| Woodie | 212.97 | 214.29 | 217.77 | 219.09 | 222.57 | 223.89 | 227.37 |
| Fibonacci | 213.92 | 215.76 | 216.89 | 218.72 | 220.56 | 221.69 | 223.52 |
| Pivot points | S3 | S2 | S1 | PP | R1 | R2 | R3 |
|---|---|---|---|---|---|---|---|
| Standard | 195.17 | 199.60 | 207.46 | 211.90 | 219.76 | 224.20 | 232.06 |
| Camarilla | 211.95 | 213.08 | 214.20 | 215.33 | 216.46 | 217.59 | 218.71 |
| Woodie | 196.88 | 200.46 | 209.18 | 212.76 | 221.48 | 225.05 | 233.78 |
| Fibonacci | 199.60 | 204.30 | 207.20 | 211.90 | 216.60 | 219.50 | 224.20 |
Numerical data
The following are the details of the technical indicators and moving averages that were collected to generate this technical analysis:
| RSI (14): | 70.87 | |
| MACD (12,26,9): | 2.5900 | |
| Directional Movement: | 6.88 | |
| AROON (14): | 100.00 | |
| DEMA (21): | 220.39 | |
| Parabolic SAR (0,02-0,02-0,2): | 215.88 | |
| Elder Ray (13): | 2.21 | |
| Super Trend (3,10): | 212.62 | |
| Zig ZAG (10): | 222.04 | |
| VORTEX (21): | 1.1900 | |
| Stochastique (14,3,5): | 94.74 | |
| TEMA (21): | 221.15 | |
| Williams %R (14): | 0.00 | |
| Chande Momentum Oscillator (20): | 4.07 | |
| Repulse (5,40,3): | 2.4000 | |
| ROCnROLL: | 1 | |
| TRIX (15,9): | 0.1700 | |
| Courbe Coppock: | 5.02 |
| MA7: | 219.15 | |
| MA20: | 216.96 | |
| MA50: | 211.57 | |
| MA100: | 208.42 | |
| MAexp7: | 219.61 | |
| MAexp20: | 217.00 | |
| MAexp50: | 212.91 | |
| MAexp100: | 208.41 | |
| Price / MA7: | +1.32% | |
| Price / MA20: | +2.34% | |
| Price / MA50: | +4.95% | |
| Price / MA100: | +6.53% | |
| Price / MAexp7: | +1.11% | |
| Price / MAexp20: | +2.32% | |
| Price / MAexp50: | +4.29% | |
| Price / MAexp100: | +6.54% |
News
The latest news and videos published on AVALONBAY COMMUNITIES INC. at the time of the analysis were as follows:
- AvalonBay Communities Announces Third Quarter 2019 Earnings Release Date
- AvalonBay Communities, Inc. Declares Third Quarter 2019 Dividends
- AvalonBay Communities Named Global and Regional Sector Leader by GRESB for its Commitment to Sustainability
- AvalonBay Communities Announces 2019 Annual Meeting Details
- AvalonBay Makes Commitment to Setting Science-Based Emissions Reduction Targets, Announces Inclusion in FTSE4Good Index
About author

Online


Add a comment
Comments
0 comments on the analysis AVALONBAY COMMUNITIES INC. - Daily