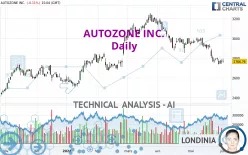
AUTOZONE INC. - Daily - Technical analysis published on 06/03/2024 (GMT)
- 178
- 0
Click here for a new analysis!
- Timeframe : Daily
- - Analysis generated on
- Status : INVALID

Summary of the analysis

Additional analysis
Quotes
The AUTOZONE INC. rating is 2,766.76 USD. The price is lower by -0.12% since the last closing and was between 2,752.44 USD and 2,794.34 USD. This implies that the price is at +0.52% from its lowest and at -0.99% from its highest.A bullish opening was detected by the Central Gaps scanner. Buyers are trying to impose a bullish momentum in the very short term.
Bullish opening
Type : Bullish
Timeframe : Openning
Here is a more detailed summary of the historical variations registered by AUTOZONE INC.:
Near a new LOW record (1 month)
Type : Bearish
Timeframe : Weekly
Technical
Technical analysis of AUTOZONE INC. in Daily shows an overall bearish trend. 75.00% of the signals given by moving averages are bearish. The overall trend is reinforced by the strong bearish signals from short-term moving averages. An assessment of moving averages reveals a bearish signal that could impact this trend:
Moving Average bearish crossovers : AMA50 & AMA100
Type : Bearish
Timeframe : Daily
Technical indicators are bearish. There is still some doubt about the decline in the price.
But beware of excesses. The Central Indicators scanner currently detects this:
Williams %R indicator is oversold : under -80
Type : Neutral
Timeframe : Daily
Price is back under the pivot point
Type : Bearish
Timeframe : Daily
Price is back under the pivot point
Type : Bearish
Timeframe : Weekly
Central Patterns, the market scanner focusing on chart patterns, resistances and supports found these results:
Near horizontal support
Type : Bullish
Timeframe : Daily
Near support of channel
Type : Bullish
Timeframe : Daily
Central Candlesticks, the scanner specialised in Japanese candlesticks, detects a bearish signal that could support the hypothesis of a small drop in the very short term:
Bearish engulfing lines
Type : Bearish
Timeframe : Daily
| S3 | S2 | S1 | Price | R1 | R2 | R3 | |
|---|---|---|---|---|---|---|---|
| ProTrendLines | 2,521.92 | 2,620.78 | 2,733.65 | 2,766.76 | 2,903.51 | 2,997.15 | 3,124.01 |
| Change (%) | -8.85% | -5.28% | -1.20% | - | +4.94% | +8.33% | +12.91% |
| Change | -244.84 | -145.98 | -33.11 | - | +136.75 | +230.39 | +357.25 |
| Level | Intermediate | Minor | Major | - | Intermediate | Major | Minor |
To determine price objectives, it is also possible to use the pivot points. Here is the price position in relation to pivot points:
| Pivot points | S3 | S2 | S1 | PP | R1 | R2 | R3 |
|---|---|---|---|---|---|---|---|
| Standard | 2,694.69 | 2,717.91 | 2,743.93 | 2,767.15 | 2,793.17 | 2,816.39 | 2,842.41 |
| Camarilla | 2,756.40 | 2,760.91 | 2,765.43 | 2,769.94 | 2,774.45 | 2,778.97 | 2,783.48 |
| Woodie | 2,696.08 | 2,718.61 | 2,745.32 | 2,767.85 | 2,794.56 | 2,817.09 | 2,843.80 |
| Fibonacci | 2,717.91 | 2,736.72 | 2,748.34 | 2,767.15 | 2,785.96 | 2,797.58 | 2,816.39 |
| Pivot points | S3 | S2 | S1 | PP | R1 | R2 | R3 |
|---|---|---|---|---|---|---|---|
| Standard | 2,674.13 | 2,706.61 | 2,738.28 | 2,770.76 | 2,802.43 | 2,834.91 | 2,866.58 |
| Camarilla | 2,752.30 | 2,758.18 | 2,764.06 | 2,769.94 | 2,775.82 | 2,781.70 | 2,787.58 |
| Woodie | 2,673.72 | 2,706.41 | 2,737.87 | 2,770.56 | 2,802.02 | 2,834.71 | 2,866.17 |
| Fibonacci | 2,706.61 | 2,731.12 | 2,746.26 | 2,770.76 | 2,795.27 | 2,810.41 | 2,834.91 |
| Pivot points | S3 | S2 | S1 | PP | R1 | R2 | R3 |
|---|---|---|---|---|---|---|---|
| Standard | 2,400.69 | 2,569.89 | 2,669.92 | 2,839.12 | 2,939.15 | 3,108.35 | 3,208.38 |
| Camarilla | 2,695.90 | 2,720.58 | 2,745.26 | 2,769.94 | 2,794.62 | 2,819.30 | 2,843.98 |
| Woodie | 2,366.10 | 2,552.60 | 2,635.33 | 2,821.83 | 2,904.56 | 3,091.06 | 3,173.79 |
| Fibonacci | 2,569.89 | 2,672.74 | 2,736.28 | 2,839.12 | 2,941.97 | 3,005.51 | 3,108.35 |
Numerical data
The following is the status of technical indicators and moving averages registered at the time this technical analysis was created:
| RSI (14): | 33.37 | |
| MACD (12,26,9): | -58.7600 | |
| Directional Movement: | -19.05 | |
| AROON (14): | -78.57 | |
| DEMA (21): | 2,775.18 | |
| Parabolic SAR (0,02-0,02-0,2): | 2,854.41 | |
| Elder Ray (13): | -43.08 | |
| Super Trend (3,10): | 2,909.63 | |
| Zig ZAG (10): | 2,766.76 | |
| VORTEX (21): | 0.7500 | |
| Stochastique (14,3,5): | 12.42 | |
| TEMA (21): | 2,744.20 | |
| Williams %R (14): | -86.93 | |
| Chande Momentum Oscillator (20): | -163.41 | |
| Repulse (5,40,3): | -0.4000 | |
| ROCnROLL: | 2 | |
| TRIX (15,9): | -0.2500 | |
| Courbe Coppock: | 12.03 |
| MA7: | 2,774.11 | |
| MA20: | 2,871.58 | |
| MA50: | 2,969.94 | |
| MA100: | 2,915.89 | |
| MAexp7: | 2,783.70 | |
| MAexp20: | 2,848.60 | |
| MAexp50: | 2,908.89 | |
| MAexp100: | 2,881.19 | |
| Price / MA7: | -0.26% | |
| Price / MA20: | -3.65% | |
| Price / MA50: | -6.84% | |
| Price / MA100: | -5.11% | |
| Price / MAexp7: | -0.61% | |
| Price / MAexp20: | -2.87% | |
| Price / MAexp50: | -4.89% | |
| Price / MAexp100: | -3.97% |
News
The latest news and videos published on AUTOZONE INC. at the time of the analysis were as follows:
- Thinking about trading options or stock in Alphabet Inc, Autozone, Zoom Video Communications, TransMedics Group, or Viking Therapeutics?
- WEX Customers Can Now Save on AutoZone Parts
- Lectron Unveils New Retail Partnership with AutoZone, America's Leading Auto Parts Retailer
- Thinking about trading options or stock in DoorDash, Fiverr, AutoZone, Amazon, or Tesla?
- Unique Logistics International Adds AutoZone Inc. As New Customer
About author
Online


Add a comment
Comments
0 comments on the analysis AUTOZONE INC. - Daily