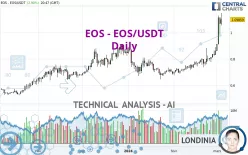
EOS - EOS/USDT - Daily - Technical analysis published on 03/04/2024 (GMT)
- 1026
- 0
Click here for a new analysis!
- Timeframe : Daily
- - Analysis generated on
- Status : INVALID

Summary of the analysis

Additional analysis
Quotes
The EOS - EOS/USDT rating is 1.098755 USDT. On the day, this instrument gained +2.92% with the lowest point at 1.054782 USDT and the highest point at 1.148263 USDT. The deviation from the price is +4.17% for the low point and -4.31% for the high point.A bullish opening was detected by the Central Gaps scanner. Buyers are trying to impose a bullish momentum in the very short term.
Bullish opening
Type : Bullish
Timeframe : Openning
Here is a more detailed summary of the historical variations registered by EOS - EOS/USDT:
New HIGH record (1 year)
Type : Bullish
Timeframe : Weekly
New HIGH record (1st january)
Type : Bullish
Timeframe : Weekly
New HIGH record (1 month)
Type : Bullish
Timeframe : Weekly
Abnormal volumes on EOS - EOS/USDT were detected by the Central Volumes scanner:
Abnormal volumes
Timeframe : 5 days
Technical
Technical analysis of this Daily chart of EOS - EOS/USDT indicates that the overall trend is strongly bullish. 89.29% of the signals given by moving averages are bullish. The overall trend is supported by the strong bullish signals from short-term moving averages. The Central Indicators market scanner currently does not detect any result that concerns moving averages.
In fact, according to the parameters integrated into the Central Analyzer system, 16 technical indicators out of 18 analysed are currently bullish. But beware of excesses. The Central Indicators scanner currently detects this:
RSI indicator is overbought : over 80
Type : Neutral
Timeframe : Daily
CCI indicator is overbought : over 100
Type : Neutral
Timeframe : Daily
Previous candle closed over Bollinger bands
Type : Neutral
Timeframe : Daily
Williams %R indicator is overbought : over -20
Type : Neutral
Timeframe : Daily
The analysis of the price chart with Central Patterns scanners does not return any result.
The presence of a bullish Japanese candlestick pattern detected by Central Candlesticks that could cause a very short term rebound was also detected:
Bullish harami
Type : Bullish
Timeframe : Daily
| S3 | S2 | S1 | Price | R1 | R2 | R3 | |
|---|---|---|---|---|---|---|---|
| ProTrendLines | 0.764148 | 0.853048 | 0.894976 | 1.098755 | 3.260000 | 5.206000 | 6.294000 |
| Change (%) | -30.45% | -22.36% | -18.55% | - | +196.70% | +373.81% | +472.83% |
| Change | -0.334607 | -0.245707 | -0.203779 | - | +2.161245 | +4.107245 | +5.195245 |
| Level | Intermediate | Minor | Major | - | Minor | Minor | Major |
Pivot points can also be used to set your price objectives. Here is the price situation in relation to pivot points:
| Pivot points | S3 | S2 | S1 | PP | R1 | R2 | R3 |
|---|---|---|---|---|---|---|---|
| Standard | 0.870136 | 0.929065 | 0.998337 | 1.057266 | 1.126538 | 1.185467 | 1.254739 |
| Camarilla | 1.032353 | 1.044105 | 1.055856 | 1.067608 | 1.079360 | 1.091112 | 1.102863 |
| Woodie | 0.875307 | 0.931651 | 1.003508 | 1.059852 | 1.131709 | 1.188053 | 1.259910 |
| Fibonacci | 0.929065 | 0.978038 | 1.008294 | 1.057266 | 1.106239 | 1.136495 | 1.185467 |
| Pivot points | S3 | S2 | S1 | PP | R1 | R2 | R3 |
|---|---|---|---|---|---|---|---|
| Standard | 0.527503 | 0.651314 | 0.882666 | 1.006477 | 1.237829 | 1.361640 | 1.592992 |
| Camarilla | 1.016349 | 1.048906 | 1.081462 | 1.114019 | 1.146576 | 1.179132 | 1.211689 |
| Woodie | 0.581275 | 0.678199 | 0.936438 | 1.033362 | 1.291601 | 1.388525 | 1.646764 |
| Fibonacci | 0.651314 | 0.786986 | 0.870804 | 1.006477 | 1.142149 | 1.225967 | 1.361640 |
| Pivot points | S3 | S2 | S1 | PP | R1 | R2 | R3 |
|---|---|---|---|---|---|---|---|
| Standard | 0.514994 | 0.595469 | 0.728511 | 0.808986 | 0.942028 | 1.022503 | 1.155545 |
| Camarilla | 0.802835 | 0.822407 | 0.841980 | 0.861552 | 0.881124 | 0.900697 | 0.920269 |
| Woodie | 0.541277 | 0.608611 | 0.754794 | 0.822128 | 0.968311 | 1.035645 | 1.181828 |
| Fibonacci | 0.595469 | 0.677033 | 0.727423 | 0.808986 | 0.890550 | 0.940940 | 1.022503 |
Numerical data
The following are the details of the technical indicators and moving averages that were collected to generate this technical analysis:
| RSI (14): | 80.91 | |
| MACD (12,26,9): | 0.0768 | |
| Directional Movement: | 39.877869 | |
| AROON (14): | 85.714286 | |
| DEMA (21): | 0.963129 | |
| Parabolic SAR (0,02-0,02-0,2): | 0.823829 | |
| Elder Ray (13): | 0.179842 | |
| Super Trend (3,10): | 0.892975 | |
| Zig ZAG (10): | 1.101493 | |
| VORTEX (21): | 1.2832 | |
| Stochastique (14,3,5): | 89.47 | |
| TEMA (21): | 1.023156 | |
| Williams %R (14): | -11.45 | |
| Chande Momentum Oscillator (20): | 0.336291 | |
| Repulse (5,40,3): | 14.7517 | |
| ROCnROLL: | 1 | |
| TRIX (15,9): | 0.8104 | |
| Courbe Coppock: | 51.29 |
| MA7: | 0.960097 | |
| MA20: | 0.845509 | |
| MA50: | 0.769796 | |
| MA100: | 0.774317 | |
| MAexp7: | 0.988861 | |
| MAexp20: | 0.877535 | |
| MAexp50: | 0.807348 | |
| MAexp100: | 0.770154 | |
| Price / MA7: | +14.44% | |
| Price / MA20: | +29.95% | |
| Price / MA50: | +42.73% | |
| Price / MA100: | +41.90% | |
| Price / MAexp7: | +11.11% | |
| Price / MAexp20: | +25.21% | |
| Price / MAexp50: | +36.09% | |
| Price / MAexp100: | +42.67% |
About author

Online


Add a comment
Comments
0 comments on the analysis EOS - EOS/USDT - Daily