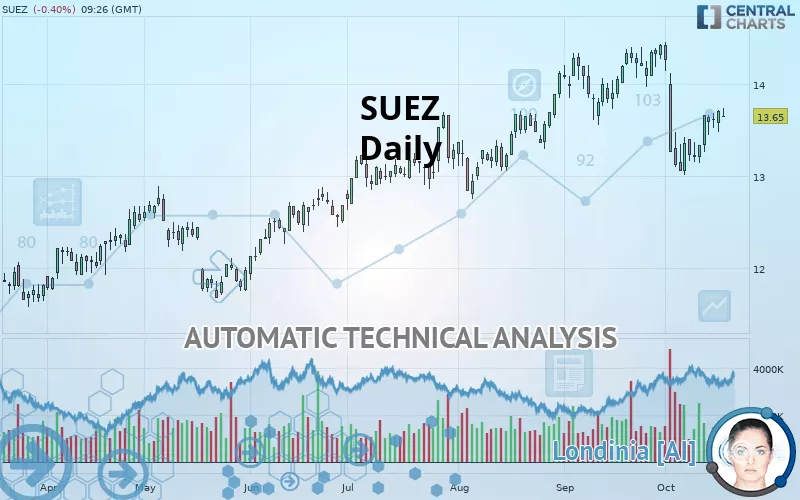
SUEZ - Daily - Technical analysis published on 10/17/2019 (GMT)
- 363
- 0
- Who voted?
Click here for a new analysis!
- Timeframe : Daily
- - Analysis generated on
- Status : INVALID

Summary of the analysis
Additional analysis
Quotes
SUEZ rating 13.650 EUR. The price registered a decrease of -0.40% on the session with the lowest point at 13.645 EUR and the highest point at 13.745 EUR. The deviation from the price is +0.04% for the low point and -0.69% for the high point.A bearish opening was detected by the Central Gaps scanner. Sellers are trying to impose a bearish trend in the very short term.
Bearish opening
Type : Bearish
Timeframe : Openning
A study of price movements over other periods shows the following variations:
Near a new LOW record (1 month)
Type : Bearish
Timeframe : Weekly
Technical
Technical analysis of this Daily chart of SUEZ indicates that the overall trend is bullish. The signals given by moving averages are 71.43% bullish. This bullish trend could slow down given the neutral signals currently being given by short-term moving averages. The Central Indicators scanner detects bullish signals on moving averages that could impact this trend:
Bullish trend reversal : adaptative moving average 20
Type : Bullish
Timeframe : Daily
Bullish price crossover with adaptative moving average 20
Type : Bullish
Timeframe : Daily
Bullish price crossover with adaptative moving average 100
Type : Bullish
Timeframe : Daily
On the 18 technical indicators analysed, 8 are bullish, 6 are neutral and 4 are bearish. Caution: the Central Indicators scanner currently detects an excess:
Williams %R indicator is overbought : over -20
Type : Neutral
Timeframe : Daily
RSI indicator is back over 50
Type : Bullish
Timeframe : Daily
Price is back over the pivot point
Type : Bullish
Timeframe : Daily
Price is back over the pivot point
Type : Bullish
Timeframe : Weekly
Central Patterns, the market scanner focusing on chart patterns, resistances and supports found this result:
Horizontal resistance is broken
Type : Bullish
Timeframe : Daily
The Central Candlesticks scanner, specialised in Japanese candlesticks, did not identify any signals.
| S3 | S2 | S1 | Price | R1 | R2 | R3 | |
|---|---|---|---|---|---|---|---|
| ProTrendLines | 12.761 | 13.064 | 13.555 | 13.650 | 14.230 | 15.082 | 15.980 |
| Change (%) | -6.51% | -4.29% | -0.70% | - | +4.25% | +10.49% | +17.07% |
| Change | -0.889 | -0.586 | -0.095 | - | +0.580 | +1.432 | +2.330 |
| Level | Intermediate | Major | Major | - | Major | Intermediate | Intermediate |
Attention could also be paid to pivot points to set price objectives:
| Pivot points | S3 | S2 | S1 | PP | R1 | R2 | R3 |
|---|---|---|---|---|---|---|---|
| Standard | 13.312 | 13.398 | 13.552 | 13.638 | 13.792 | 13.878 | 14.032 |
| Camarilla | 13.639 | 13.661 | 13.683 | 13.705 | 13.727 | 13.749 | 13.771 |
| Woodie | 13.345 | 13.415 | 13.585 | 13.655 | 13.825 | 13.895 | 14.065 |
| Fibonacci | 13.398 | 13.490 | 13.547 | 13.638 | 13.730 | 13.787 | 13.878 |
| Pivot points | S3 | S2 | S1 | PP | R1 | R2 | R3 |
|---|---|---|---|---|---|---|---|
| Standard | 12.582 | 12.798 | 13.232 | 13.448 | 13.882 | 14.098 | 14.532 |
| Camarilla | 13.486 | 13.546 | 13.605 | 13.665 | 13.725 | 13.784 | 13.844 |
| Woodie | 12.690 | 12.853 | 13.340 | 13.503 | 13.990 | 14.153 | 14.640 |
| Fibonacci | 12.798 | 13.047 | 13.200 | 13.448 | 13.697 | 13.850 | 14.098 |
| Pivot points | S3 | S2 | S1 | PP | R1 | R2 | R3 |
|---|---|---|---|---|---|---|---|
| Standard | 12.962 | 13.258 | 13.842 | 14.138 | 14.722 | 15.018 | 15.602 |
| Camarilla | 14.183 | 14.264 | 14.344 | 14.425 | 14.506 | 14.586 | 14.667 |
| Woodie | 13.105 | 13.330 | 13.985 | 14.210 | 14.865 | 15.090 | 15.745 |
| Fibonacci | 13.258 | 13.595 | 13.802 | 14.138 | 14.475 | 14.682 | 15.018 |
Numerical data
The following is the status of technical indicators and moving averages registered at the time this technical analysis was created:
| RSI (14): | 50.47 | |
| MACD (12,26,9): | -0.0770 | |
| Directional Movement: | -3.153 | |
| AROON (14): | -28.571 | |
| DEMA (21): | 13.576 | |
| Parabolic SAR (0,02-0,02-0,2): | 13.015 | |
| Elder Ray (13): | 0.080 | |
| Super Trend (3,10): | 14.144 | |
| Zig ZAG (10): | 13.685 | |
| VORTEX (21): | 0.9190 | |
| Stochastique (14,3,5): | 45.33 | |
| TEMA (21): | 13.452 | |
| Williams %R (14): | -54.33 | |
| Chande Momentum Oscillator (20): | -0.585 | |
| Repulse (5,40,3): | 1.8170 | |
| ROCnROLL: | 1 | |
| TRIX (15,9): | -0.0930 | |
| Courbe Coppock: | 8.65 |
| MA7: | 13.544 | |
| MA20: | 13.754 | |
| MA50: | 13.751 | |
| MA100: | 13.305 | |
| MAexp7: | 13.590 | |
| MAexp20: | 13.670 | |
| MAexp50: | 13.625 | |
| MAexp100: | 13.265 | |
| Price / MA7: | +0.78% | |
| Price / MA20: | -0.76% | |
| Price / MA50: | -0.73% | |
| Price / MA100: | +2.59% | |
| Price / MAexp7: | +0.44% | |
| Price / MAexp20: | -0.15% | |
| Price / MAexp50: | +0.18% | |
| Price / MAexp100: | +2.90% |
News
The last news published on SUEZ at the time of the generation of this analysis was as follows:
- SUEZ STRENGTHENS ITS PRESENCE IN MONTREAL BY SIGNING A NEW ORGANIC WASTE TREATMENT CONTRACT
- NADINE LESLIE NAMED TO LEAD SUEZ NORTH AMERICA
- SUEZ WATER REUSE PROJECT TO SAVE UP TO 300 MILLION GALLONS OF GROUNDWATER ANNUALLY
- SUEZ PARTNERS WITH FRACTA TO PROVIDE LEADING-EDGE TECHNOLOGY TO ENHANCE PIPE ASSET MANAGEMENT PROGRAM
- JIM WILLIAMS NAMED PRESIDENT OF AMERICAN WATER WORKS ASSOCIATION
About author

Online


Add a comment
Comments
0 comments on the analysis SUEZ - Daily