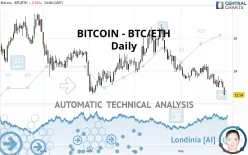
BITCOIN - BTC/ETH - Daily - Technical analysis published on 11/30/2021 (GMT)
- 388
- 0
Click here for a new analysis!
- Timeframe : Daily
- - Analysis generated on
- Status : TARGET REACHED

Summary of the analysis

Additional analysis
Quotes
The BITCOIN - BTC/ETH rating is 12.54 ETH. The price is lower by -3.54% since the last closing with the lowest point at 12.52 ETH and the highest point at 13.00 ETH. The deviation from the price is +0.16% for the low point and -3.54% for the high point.A study of price movements over other periods shows the following variations:
New LOW record (1 month)
Type : Bearish
Timeframe : Weekly
Technical
Technical analysis of BITCOIN - BTC/ETH in Daily shows a overall strongly bearish trend. 89.29% of the signals given by moving averages are bearish. The overall trend is supported by the strong bearish signals from short-term moving averages. The Central Indicators market scanner currently does not detect any result that concerns moving averages.
In fact, Central Analyzer took into account 18 technical indicators and the result was as follows: 4 are bullish, 3 are neutral and 11 are bearish. Caution: the Central Indicators scanner currently detects an excess:
CCI indicator is oversold : under -100
Type : Neutral
Timeframe : Daily
Williams %R indicator is oversold : under -80
Type : Neutral
Timeframe : Daily
Pivot points : price is under support 1
Type : Neutral
Timeframe : Weekly
Pivot points : price is under support 3
Type : Neutral
Timeframe : Daily
The Central Patterns scanner, which studies chart patterns, resistances and supports, has identified this signal:
Support of channel is broken
Type : Bearish
Timeframe : Daily
The Central Candlesticks scanner which studies Japanese candlesticks did not detect anything.
| S1 | Price | R1 | R2 | R3 | |
|---|---|---|---|---|---|
| ProTrendLines | 12.46 | 12.54 | 13.55 | 14.62 | 16.58 |
| Change (%) | -0.64% | - | +8.05% | +16.59% | +32.22% |
| Change | -0.08 | - | +1.01 | +2.08 | +4.04 |
| Level | Major | - | Intermediate | Intermediate | Intermediate |
Attention could also be paid to pivot points to set price objectives:
| Pivot points | S3 | S2 | S1 | PP | R1 | R2 | R3 |
|---|---|---|---|---|---|---|---|
| Standard | 12.53 | 12.77 | 12.88 | 13.12 | 13.23 | 13.47 | 13.58 |
| Camarilla | 12.90 | 12.94 | 12.97 | 13.00 | 13.03 | 13.06 | 13.10 |
| Woodie | 12.48 | 12.74 | 12.83 | 13.09 | 13.18 | 13.44 | 13.53 |
| Fibonacci | 12.77 | 12.90 | 12.98 | 13.12 | 13.25 | 13.33 | 13.47 |
| Pivot points | S3 | S2 | S1 | PP | R1 | R2 | R3 |
|---|---|---|---|---|---|---|---|
| Standard | 12.08 | 12.53 | 12.95 | 13.40 | 13.82 | 14.27 | 14.69 |
| Camarilla | 13.13 | 13.21 | 13.29 | 13.37 | 13.45 | 13.53 | 13.61 |
| Woodie | 12.07 | 12.52 | 12.94 | 13.39 | 13.81 | 14.26 | 14.68 |
| Fibonacci | 12.53 | 12.86 | 13.07 | 13.40 | 13.73 | 13.94 | 14.27 |
| Pivot points | S3 | S2 | S1 | PP | R1 | R2 | R3 |
|---|---|---|---|---|---|---|---|
| Standard | 10.27 | 12.10 | 13.20 | 15.03 | 16.13 | 17.96 | 19.06 |
| Camarilla | 13.50 | 13.77 | 14.04 | 14.31 | 14.58 | 14.85 | 15.12 |
| Woodie | 9.92 | 11.92 | 12.85 | 14.85 | 15.78 | 17.78 | 18.71 |
| Fibonacci | 12.10 | 13.22 | 13.91 | 15.03 | 16.15 | 16.84 | 17.96 |
Numerical data
The following is the status of the technical indicators and moving averages at the time of publication of this technical analysis:
| RSI (14): | 32.85 | |
| MACD (12,26,9): | -0.3300 | |
| Directional Movement: | -16.05 | |
| AROON (14): | -85.71 | |
| DEMA (21): | 13.08 | |
| Parabolic SAR (0,02-0,02-0,2): | 13.70 | |
| Elder Ray (13): | -0.57 | |
| Super Trend (3,10): | 14.01 | |
| Zig ZAG (10): | 12.62 | |
| VORTEX (21): | 0.8300 | |
| Stochastique (14,3,5): | 10.14 | |
| TEMA (21): | 12.97 | |
| Williams %R (14): | -95.26 | |
| Chande Momentum Oscillator (20): | -1.62 | |
| Repulse (5,40,3): | -6.4900 | |
| ROCnROLL: | 2 | |
| TRIX (15,9): | -0.2900 | |
| Courbe Coppock: | 11.99 |
| MA7: | 13.15 | |
| MA20: | 13.59 | |
| MA50: | 14.31 | |
| MA100: | 14.29 | |
| MAexp7: | 13.12 | |
| MAexp20: | 13.50 | |
| MAexp50: | 13.98 | |
| MAexp100: | 14.51 | |
| Price / MA7: | -4.64% | |
| Price / MA20: | -7.73% | |
| Price / MA50: | -12.37% | |
| Price / MA100: | -12.25% | |
| Price / MAexp7: | -4.42% | |
| Price / MAexp20: | -7.11% | |
| Price / MAexp50: | -10.30% | |
| Price / MAexp100: | -13.58% |
About author

Online


Add a comment
Comments
0 comments on the analysis BITCOIN - BTC/ETH - Daily