| Open: | 18.90 |
| Change: | +0.02 |
| Volume: | 117,414 |
| Low: | 18.83 |
| High: | 18.91 |
| High / Low range: | 0.08 |
| Type: | Cryptocurrencies |
| Ticker: | IOTAUSD |
| ISIN: |
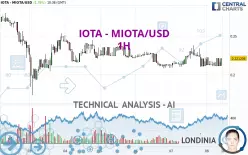
IOTA - IOTA/USD - 1H - Technical analysis published on 02/08/2025 (GMT)
- 160
- 0
- 02/08/2025 - 10:40
Click here for a new analysis!
- Timeframe : 1H
- - Analysis generated on 02/08/2025 - 10:40
- Status : INVALID

Summary of the analysis

Additional analysis
Quotes
IOTA - MIOTA/USD rating 0.221206 USD. The price registered an increase of +1.78% on the session and was between 0.210776 USD and 0.222729 USD. This implies that the price is at +4.95% from its lowest and at -0.68% from its highest.A bearish opening was detected by the Central Gaps scanner. Sellers are trying to impose a bearish trend in the very short term.
Bearish opening
Type : Bearish
Timeframe : Openning
A study of price movements over other periods shows the following variations:
Technical
Technical analysis of IOTA - MIOTA/USD in 1H shows an overall bearish trend. 67.86% of the signals given by moving averages are bearish. Caution: the slightly bullish signals currently given by short-term moving averages show a possible weakening of the global trend. The Central Indicators scanner does not detect any result on moving averages that would impact this trend.
The technical indicators are generally neutral. They do not provide relevant information on the direction of future price movements.
Central Indicators, the scanner specialised in technical indicators, has identified these signals:
Pivot points : price is under support 3
Type : Neutral
Timeframe : Weekly
MACD crosses UP its Moving Average
Type : Bullish
Timeframe : 1 hour
Momentum indicator is back over 0
Type : Bullish
Timeframe : 1 hour
Williams %R indicator is back over -50
Type : Bullish
Timeframe : 1 hour
Central Patterns, the market scanner focusing on chart patterns, resistances and supports found this result:
Near horizontal resistance
Type : Bearish
Timeframe : 1 hour
Central Candlesticks, the scanner specialised in Japanese candlesticks, detects this inversion signal that could impact the current short-term trend:
Doji
Type : Neutral
Timeframe : 1 hour
| S3 | S2 | S1 | Price | R1 | R2 | R3 | |
|---|---|---|---|---|---|---|---|
| ProTrendLines | 0.173425 | 0.205428 | 0.221163 | 0.221206 | 0.237500 | 0.253520 | 0.270218 |
| Change (%) | -21.60% | -7.13% | -0.02% | - | +7.37% | +14.61% | +22.16% |
| Change | -0.047781 | -0.015778 | -0.000043 | - | +0.016294 | +0.032314 | +0.049012 |
| Level | Minor | Major | Intermediate | - | Intermediate | Minor | Intermediate |
Pivot points can also be used to set your price objectives. Here is the price situation in relation to pivot points:
| Pivot points | S3 | S2 | S1 | PP | R1 | R2 | R3 |
|---|---|---|---|---|---|---|---|
| Standard | 0.176249 | 0.192709 | 0.205020 | 0.221480 | 0.233791 | 0.250251 | 0.262562 |
| Camarilla | 0.209418 | 0.212055 | 0.214693 | 0.217330 | 0.219967 | 0.222605 | 0.225242 |
| Woodie | 0.174174 | 0.191672 | 0.202945 | 0.220443 | 0.231716 | 0.249214 | 0.260487 |
| Fibonacci | 0.192709 | 0.203700 | 0.210490 | 0.221480 | 0.232471 | 0.239261 | 0.250251 |
| Pivot points | S3 | S2 | S1 | PP | R1 | R2 | R3 |
|---|---|---|---|---|---|---|---|
| Standard | 0.188495 | 0.229292 | 0.255546 | 0.296343 | 0.322597 | 0.363394 | 0.389648 |
| Camarilla | 0.263360 | 0.269506 | 0.275653 | 0.281799 | 0.287945 | 0.294092 | 0.300238 |
| Woodie | 0.181223 | 0.225656 | 0.248274 | 0.292707 | 0.315325 | 0.359758 | 0.382376 |
| Fibonacci | 0.229292 | 0.254906 | 0.270730 | 0.296343 | 0.321957 | 0.337781 | 0.363394 |
| Pivot points | S3 | S2 | S1 | PP | R1 | R2 | R3 |
|---|---|---|---|---|---|---|---|
| Standard | 0.080173 | 0.175131 | 0.238486 | 0.333444 | 0.396799 | 0.491757 | 0.555112 |
| Camarilla | 0.258304 | 0.272816 | 0.287328 | 0.301840 | 0.316352 | 0.330864 | 0.345376 |
| Woodie | 0.064371 | 0.167230 | 0.222684 | 0.325543 | 0.380997 | 0.483856 | 0.539310 |
| Fibonacci | 0.175131 | 0.235607 | 0.272969 | 0.333444 | 0.393920 | 0.431282 | 0.491757 |
Numerical data
The following is the status of the technical indicators and moving averages at the time of publication of this technical analysis:
| RSI (14): | 49.89 | |
| MACD (12,26,9): | -0.0016 | |
| Directional Movement: | 5.045022 | |
| AROON (14): | 0 | |
| DEMA (21): | 0.214083 | |
| Parabolic SAR (0,02-0,02-0,2): | 0.231188 | |
| Elder Ray (13): | -0.000870 | |
| Super Trend (3,10): | 0.235296 | |
| Zig ZAG (10): | 0.211609 | |
| VORTEX (21): | 0.9466 | |
| Stochastique (14,3,5): | 17.28 | |
| TEMA (21): | 0.213210 | |
| Williams %R (14): | -90.88 | |
| Chande Momentum Oscillator (20): | 0.000349 | |
| Repulse (5,40,3): | -1.6846 | |
| ROCnROLL: | 2 | |
| TRIX (15,9): | -0.0776 | |
| Courbe Coppock: | 5.14 |
| MA7: | 0.225109 | |
| MA20: | 0.280284 | |
| MA50: | 0.310948 | |
| MA100: | 0.286183 | |
| MAexp7: | 0.215557 | |
| MAexp20: | 0.216036 | |
| MAexp50: | 0.218833 | |
| MAexp100: | 0.225071 | |
| Price / MA7: | -1.73% | |
| Price / MA20: | -21.08% | |
| Price / MA50: | -28.86% | |
| Price / MA100: | -22.70% | |
| Price / MAexp7: | +2.62% | |
| Price / MAexp20: | +2.39% | |
| Price / MAexp50: | +1.08% | |
| Price / MAexp100: | -1.72% |
About author
Online


Add a comment
Comments
0 comments on the analysis IOTA - IOTA/USD - 1H