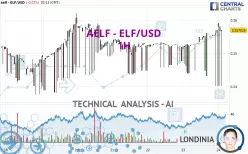
AELF - ELF/USD - 1H - Technical analysis published on 03/24/2025 (GMT)
- 78
- 0
Click here for a new analysis!
- Timeframe : 1H
- - Analysis generated on
- Status : TARGET REACHED

Summary of the analysis

Additional analysis
Quotes
The AELF - ELF/USD price is 0.257025 USD. The price is lower by -0.02% since the last closing and was between 0.240200 USD and 0.259029 USD. This implies that the price is at +7.00% from its lowest and at -0.77% from its highest.The Central Gaps scanner detects the formation of a bullish gap marking the strong presence of buyers against sellers at the opening. This formed a quotation gap.
Opening Gap UP
Type : Bullish
Timeframe : Openning
Here is a more detailed summary of the historical variations registered by AELF - ELF/USD:
Technical
Technical analysis of AELF - ELF/USD in 1H shows a strongly overall bullish trend. 82.14% of the signals given by moving averages are bullish. The overall trend is supported by the strong bullish signals from short-term moving averages. The Central Indicators scanner detects a bullish signal on moving averages that could impact this trend:
Moving Average bullish crossovers : MA50 & MA100
Type : Bullish
Timeframe : 1 hour
In fact, 12 technical indicators on 18 studied are currently bullish. Caution: the Central Indicators scanner currently detects an excess:
Williams %R indicator is overbought : over -20
Type : Neutral
Timeframe : 1 hour
Parabolic SAR indicator bearish reversal
Type : Bearish
Timeframe : 1 hour
Price is back under the pivot point (Daily)
Type : Bearish
Timeframe : 1 hour
Central Patterns, the scanner specializing in chart patterns, did not identify any signals.
The presence of these Japanese chandelier patterns detected by Central Candlesticks that could impact the current short-term trend were also noted:
White hanging man / hammer
Type : Neutral
Timeframe : 1 hour
Dragon-fly doji
Type : Bullish
Timeframe : 1 hour
Grip bottom and hammer
Type : Bullish
Timeframe : 1 hour
| S3 | S2 | S1 | Price | R1 | R2 | R3 | |
|---|---|---|---|---|---|---|---|
| ProTrendLines | 0.195297 | 0.243689 | 0.252819 | 0.257025 | 0.262169 | 0.322289 | 0.333944 |
| Change (%) | -24.02% | -5.19% | -1.64% | - | +2.00% | +25.39% | +29.93% |
| Change | -0.061728 | -0.013336 | -0.004206 | - | +0.005144 | +0.065264 | +0.076919 |
| Level | Minor | Intermediate | Intermediate | - | Minor | Minor | Minor |
Attention could also be paid to pivot points to set price objectives:
| Pivot points | S3 | S2 | S1 | PP | R1 | R2 | R3 |
|---|---|---|---|---|---|---|---|
| Standard | 0.228941 | 0.234580 | 0.245826 | 0.251465 | 0.262711 | 0.268350 | 0.279596 |
| Camarilla | 0.252428 | 0.253975 | 0.255523 | 0.257071 | 0.258619 | 0.260167 | 0.261714 |
| Woodie | 0.231744 | 0.235982 | 0.248629 | 0.252867 | 0.265514 | 0.269752 | 0.282399 |
| Fibonacci | 0.234580 | 0.241030 | 0.245015 | 0.251465 | 0.257915 | 0.261900 | 0.268350 |
| Pivot points | S3 | S2 | S1 | PP | R1 | R2 | R3 |
|---|---|---|---|---|---|---|---|
| Standard | 0.211666 | 0.224653 | 0.236196 | 0.249183 | 0.260726 | 0.273713 | 0.285256 |
| Camarilla | 0.240994 | 0.243243 | 0.245491 | 0.247740 | 0.249989 | 0.252237 | 0.254486 |
| Woodie | 0.210945 | 0.224292 | 0.235475 | 0.248822 | 0.260005 | 0.273352 | 0.284535 |
| Fibonacci | 0.224653 | 0.234023 | 0.239812 | 0.249183 | 0.258553 | 0.264342 | 0.273713 |
| Pivot points | S3 | S2 | S1 | PP | R1 | R2 | R3 |
|---|---|---|---|---|---|---|---|
| Standard | 0.110491 | 0.173352 | 0.212929 | 0.275790 | 0.315367 | 0.378228 | 0.417805 |
| Camarilla | 0.224337 | 0.233727 | 0.243117 | 0.252507 | 0.261897 | 0.271287 | 0.280678 |
| Woodie | 0.098850 | 0.167531 | 0.201288 | 0.269969 | 0.303726 | 0.372407 | 0.406164 |
| Fibonacci | 0.173352 | 0.212483 | 0.236658 | 0.275790 | 0.314921 | 0.339096 | 0.378228 |
Numerical data
The following is the status of technical indicators and moving averages registered at the time this technical analysis was created:
| RSI (14): | 56.96 | |
| MACD (12,26,9): | 0.0013 | |
| Directional Movement: | -17.684925 | |
| AROON (14): | -14.285714 | |
| DEMA (21): | 0.256925 | |
| Parabolic SAR (0,02-0,02-0,2): | 0.259029 | |
| Elder Ray (13): | -0.007545 | |
| Super Trend (3,10): | 0.260122 | |
| Zig ZAG (10): | 0.256703 | |
| VORTEX (21): | 0.8844 | |
| Stochastique (14,3,5): | 92.26 | |
| TEMA (21): | 0.257625 | |
| Williams %R (14): | -11.11 | |
| Chande Momentum Oscillator (20): | 0.001892 | |
| Repulse (5,40,3): | 11.4152 | |
| ROCnROLL: | 1 | |
| TRIX (15,9): | 0.0673 | |
| Courbe Coppock: | 2.29 |
| MA7: | 0.250566 | |
| MA20: | 0.251828 | |
| MA50: | 0.269619 | |
| MA100: | 0.357995 | |
| MAexp7: | 0.256729 | |
| MAexp20: | 0.255295 | |
| MAexp50: | 0.253695 | |
| MAexp100: | 0.252696 | |
| Price / MA7: | +2.58% | |
| Price / MA20: | +2.06% | |
| Price / MA50: | -4.67% | |
| Price / MA100: | -28.20% | |
| Price / MAexp7: | +0.12% | |
| Price / MAexp20: | +0.68% | |
| Price / MAexp50: | +1.31% | |
| Price / MAexp100: | +1.71% |
About author
Online


Add a comment
Comments
0 comments on the analysis AELF - ELF/USD - 1H