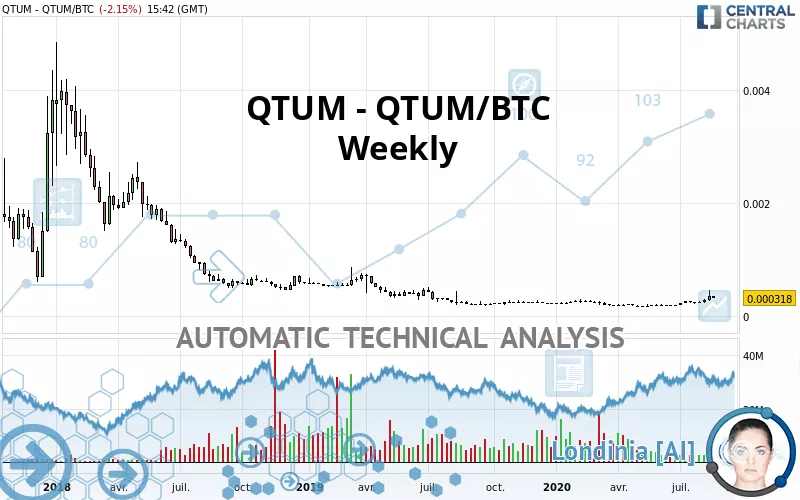
QTUM - QTUM/BTC - Weekly - Technical analysis published on 08/25/2020 (GMT)
- 200
- 0
- Who voted?
Click here for a new analysis!
- Timeframe : Weekly
- - Analysis generated on
- Status : INVALID

Summary of the analysis

Additional analysis
Quotes
The QTUM - QTUM/BTC price is 0.000318 BTC. The price is up +13.17% over 5 days with the lowest point at 0.000301 BTC and the highest point at 0.000463 BTC. The deviation from the price is +5.65% for the low point and -31.32% for the high point.Here is a more detailed summary of the historical variations registered by QTUM - QTUM/BTC:
Technical
Technical analysis of this Weekly chart of QTUM - QTUM/BTC indicates that the overall trend is not clearly defined. The strong bullish signals currently being given by short-term moving averages could allow the overall trend to return to bullish. The Central Indicators scanner detects bullish signals on moving averages that could impact this trend:
Bullish trend reversal : adaptative moving average 50
Type : Bullish
Timeframe : Weekly
Moving Average bullish crossovers : AMA20 & AMA50
Type : Bullish
Timeframe : Weekly
Bullish price crossover with Moving Average 100
Type : Bullish
Timeframe : Weekly
An assessment of technical indicators shows a strong bullish signal.
Caution: the Central Indicators scanner currently detects an excess:
RSI indicator is overbought : over 70
Type : Neutral
Timeframe : Weekly
CCI indicator is overbought : over 100
Type : Neutral
Timeframe : Weekly
Williams %R indicator is overbought : over -20
Type : Neutral
Timeframe : Weekly
No signals are given by Central Patterns, a market scanner specialised in chart patterns, resistances and supports.
Central Candlesticks, the scanner specialised in Japanese candlesticks, detects a bullish signal that could support the hypothesis of a small rebound in the very short term:
Long white line
Type : Bullish
Timeframe : Weekly
| S1 | Price | R1 | R2 | R3 | |
|---|---|---|---|---|---|
| ProTrendLines | 0.000285 | 0.000318 | 0.000706 | 0.001625 | 0.002443 |
| Change (%) | -10.38% | - | +122.01% | +411.01% | +668.24% |
| Change | -0.000033 | - | +0.000388 | +0.001307 | +0.002125 |
| Level | Major | - | Intermediate | Minor | Minor |
Attention could also be paid to pivot points to set price objectives:
| Pivot points | S3 | S2 | S1 | PP | R1 | R2 | R3 |
|---|---|---|---|---|---|---|---|
| Standard | 0.000278 | 0.000300 | 0.000312 | 0.000334 | 0.000346 | 0.000368 | 0.000380 |
| Camarilla | 0.000316 | 0.000319 | 0.000322 | 0.000325 | 0.000328 | 0.000331 | 0.000334 |
| Woodie | 0.000274 | 0.000298 | 0.000308 | 0.000332 | 0.000342 | 0.000366 | 0.000376 |
| Fibonacci | 0.000300 | 0.000313 | 0.000321 | 0.000334 | 0.000347 | 0.000355 | 0.000368 |
| Pivot points | S3 | S2 | S1 | PP | R1 | R2 | R3 |
|---|---|---|---|---|---|---|---|
| Standard | 0.000042 | 0.000147 | 0.000252 | 0.000357 | 0.000462 | 0.000567 | 0.000672 |
| Camarilla | 0.000298 | 0.000318 | 0.000337 | 0.000356 | 0.000375 | 0.000395 | 0.000414 |
| Woodie | 0.000041 | 0.000147 | 0.000251 | 0.000357 | 0.000461 | 0.000567 | 0.000671 |
| Fibonacci | 0.000147 | 0.000228 | 0.000277 | 0.000357 | 0.000438 | 0.000487 | 0.000567 |
| Pivot points | S3 | S2 | S1 | PP | R1 | R2 | R3 |
|---|---|---|---|---|---|---|---|
| Standard | 0.000080 | 0.000128 | 0.000171 | 0.000219 | 0.000262 | 0.000310 | 0.000353 |
| Camarilla | 0.000188 | 0.000196 | 0.000205 | 0.000213 | 0.000221 | 0.000230 | 0.000238 |
| Woodie | 0.000077 | 0.000127 | 0.000168 | 0.000218 | 0.000259 | 0.000309 | 0.000350 |
| Fibonacci | 0.000128 | 0.000163 | 0.000185 | 0.000219 | 0.000254 | 0.000276 | 0.000310 |
Numerical data
The following is the status of the technical indicators and moving averages at the time of publication of this technical analysis:
| RSI (14): | 65.61 | |
| MACD (12,26,9): | 0.0000 | |
| Directional Movement: | 31.270157 | |
| AROON (14): | 92.857140 | |
| DEMA (21): | 0.000256 | |
| Parabolic SAR (0,02-0,02-0,2): | 0.000200 | |
| Elder Ray (13): | 0.000089 | |
| Super Trend (3,10): | 0.000201 | |
| Zig ZAG (10): | 0.000322 | |
| VORTEX (21): | 1.1539 | |
| Stochastique (14,3,5): | 69.12 | |
| TEMA (21): | 0.000291 | |
| Williams %R (14): | -48.12 | |
| Chande Momentum Oscillator (20): | 0.000131 | |
| Repulse (5,40,3): | 3.6843 | |
| ROCnROLL: | 1 | |
| TRIX (15,9): | 0.1515 | |
| Courbe Coppock: | 100.20 |
| MA7: | 0.000328 | |
| MA20: | 0.000278 | |
| MA50: | 0.000252 | |
| MA100: | 0.000217 | |
| MAexp7: | 0.000279 | |
| MAexp20: | 0.000239 | |
| MAexp50: | 0.000271 | |
| MAexp100: | 0.000448 | |
| Price / MA7: | -3.05% | |
| Price / MA20: | +14.39% | |
| Price / MA50: | +26.19% | |
| Price / MA100: | +46.54% | |
| Price / MAexp7: | +13.98% | |
| Price / MAexp20: | +33.05% | |
| Price / MAexp50: | +17.34% | |
| Price / MAexp100: | -29.02% |
About author

Online


Add a comment
Comments
0 comments on the analysis QTUM - QTUM/BTC - Weekly