| Open: | 43.96 |
| Change: | +1.81 |
| Volume: | 38,732,402 |
| Low: | 41.85 |
| High: | 44.99 |
| High / Low range: | 3.14 |
| Type: | Cryptocurrencies |
| Ticker: | XMRUSD |
| ISIN: |
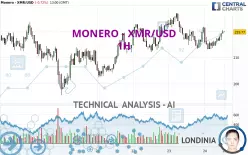
MONERO - XMR/USD - 1H - Technical analysis published on 01/24/2025 (GMT)
- 88
- 0
- 01/24/2025 - 13:00
Click here for a new analysis!
- Timeframe : 1H
- - Analysis generated on 01/24/2025 - 13:00
- Status : TARGET REACHED

Summary of the analysis

Additional analysis
Quotes
The MONERO - XMR/USD rating is 219.77 USD. The price registered a decrease of -0.72% on the session and was traded between 213.05 USD and 221.41 USD over the period. The price is currently at +3.15% from its lowest and -0.74% from its highest.The Central Gaps scanner detects a bullish opening marking the presence of buyers ahead of sellers at the opening but not sufficiently marked to allow the price to register a quotation gap.
Bullish opening
Type : Bullish
Timeframe : Openning
So that you have an overall view of the price change, here is a table showing the variations over several periods:
Technical
Technical analysis of MONERO - XMR/USD in 1H shows a strongly overall bullish trend. 85.71% of the signals given by moving averages are bullish. The overall trend is supported by the strong bullish signals from short-term moving averages. There is no crossing of moving average by the price or crossing of moving averages between themselves.
The probability of a further increase are moderate given the direction of the technical indicators.
But beware of excesses. The Central Indicators scanner currently detects this:
CCI indicator is overbought : over 100
Type : Neutral
Timeframe : 1 hour
Parabolic SAR indicator bullish reversal
Type : Bullish
Timeframe : 1 hour
Momentum indicator is back over 0
Type : Bullish
Timeframe : 1 hour
The analysis of the price chart with Central Patterns scanners does not return any result.
The presence of these Japanese chandelier patterns detected by Central Candlesticks that could impact the current short-term trend were also noted:
White gravestone / inverted hammer
Type : Neutral
Timeframe : 1 hour
Bearish doji star
Type : Bearish
Timeframe : 1 hour
| S3 | S2 | S1 | Price | R1 | R2 | R3 | |
|---|---|---|---|---|---|---|---|
| ProTrendLines | 202.49 | 212.13 | 219.53 | 219.77 | 222.79 | 226.93 | 230.42 |
| Change (%) | -7.86% | -3.48% | -0.11% | - | +1.37% | +3.26% | +4.85% |
| Change | -17.28 | -7.64 | -0.24 | - | +3.02 | +7.16 | +10.65 |
| Level | Minor | Intermediate | Minor | - | Major | Intermediate | Minor |
To determine price objectives, it is also possible to use the pivot points. Here is the price position in relation to pivot points:
| Pivot points | S3 | S2 | S1 | PP | R1 | R2 | R3 |
|---|---|---|---|---|---|---|---|
| Standard | 200.38 | 206.81 | 214.08 | 220.51 | 227.78 | 234.21 | 241.48 |
| Camarilla | 217.59 | 218.85 | 220.10 | 221.36 | 222.62 | 223.87 | 225.13 |
| Woodie | 200.81 | 207.02 | 214.51 | 220.72 | 228.21 | 234.42 | 241.91 |
| Fibonacci | 206.81 | 212.04 | 215.27 | 220.51 | 225.74 | 228.97 | 234.21 |
| Pivot points | S3 | S2 | S1 | PP | R1 | R2 | R3 |
|---|---|---|---|---|---|---|---|
| Standard | 148.59 | 169.65 | 193.60 | 214.66 | 238.61 | 259.67 | 283.62 |
| Camarilla | 205.17 | 209.30 | 213.42 | 217.55 | 221.68 | 225.80 | 229.93 |
| Woodie | 150.04 | 170.37 | 195.05 | 215.38 | 240.06 | 260.39 | 285.07 |
| Fibonacci | 169.65 | 186.84 | 197.47 | 214.66 | 231.85 | 242.48 | 259.67 |
| Pivot points | S3 | S2 | S1 | PP | R1 | R2 | R3 |
|---|---|---|---|---|---|---|---|
| Standard | 86.36 | 123.11 | 158.13 | 194.88 | 229.90 | 266.65 | 301.67 |
| Camarilla | 173.41 | 179.99 | 186.57 | 193.15 | 199.73 | 206.31 | 212.89 |
| Woodie | 85.50 | 122.68 | 157.27 | 194.45 | 229.04 | 266.22 | 300.81 |
| Fibonacci | 123.11 | 150.53 | 167.46 | 194.88 | 222.30 | 239.23 | 266.65 |
Numerical data
The following is the status of the technical indicators and moving averages at the time of publication of this technical analysis:
| RSI (14): | 54.77 | |
| MACD (12,26,9): | -0.1200 | |
| Directional Movement: | 5.43 | |
| AROON (14): | -21.43 | |
| DEMA (21): | 216.86 | |
| Parabolic SAR (0,02-0,02-0,2): | 220.18 | |
| Elder Ray (13): | 2.09 | |
| Super Trend (3,10): | 223.11 | |
| Zig ZAG (10): | 219.49 | |
| VORTEX (21): | 1.0500 | |
| Stochastique (14,3,5): | 67.66 | |
| TEMA (21): | 217.14 | |
| Williams %R (14): | -21.19 | |
| Chande Momentum Oscillator (20): | 4.30 | |
| Repulse (5,40,3): | 1.9300 | |
| ROCnROLL: | 1 | |
| TRIX (15,9): | -0.0500 | |
| Courbe Coppock: | 0.64 |
| MA7: | 215.32 | |
| MA20: | 207.88 | |
| MA50: | 201.84 | |
| MA100: | 181.48 | |
| MAexp7: | 217.98 | |
| MAexp20: | 217.23 | |
| MAexp50: | 217.29 | |
| MAexp100: | 216.15 | |
| Price / MA7: | +2.07% | |
| Price / MA20: | +5.72% | |
| Price / MA50: | +8.88% | |
| Price / MA100: | +21.10% | |
| Price / MAexp7: | +0.82% | |
| Price / MAexp20: | +1.17% | |
| Price / MAexp50: | +1.14% | |
| Price / MAexp100: | +1.67% |
About author
Online


Add a comment
Comments
0 comments on the analysis MONERO - XMR/USD - 1H