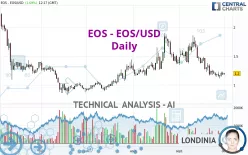
EOS - EOS/USD - Daily - Technical analysis published on 10/01/2022 (GMT)
- 270
- 0
I am pleased to note that the threshold for invalidation has been maintained for 20 Candlesticks.
Click here for a new analysis!
Click here for a new analysis!
- Timeframe : Daily
- - Analysis generated on
- Status : LEVEL MAINTAINED

Summary of the analysis
Trends
Short term:
Strongly bearish
Underlying:
Bearish
Technical indicators
33%
44%
22%
My opinion
Bearish under 1.38 USD
My targets
0.91 USD (-24.42%)
My analysis
In the short term, we can see an acceleration in the bearish trend on EOS - EOS/USD, which is a positive signal for sellers. As long as the price remains above 1.38 USD, a sale could be considered. The first bearish objective is located at 0.91 USD. The bearish momentum would be revived by a break in this support. If the price were to return above 1.38 USD, it would probably only trigger a small rebound in the short term to give a better base for restarting. Trading this rebound may be risky.
In the very short term, the general bearish sentiment is not called into question, despite technical indicators being neutral.
Force
0
10
4.6
Warning: This content is for information purposes only and in no way constitutes investment advice or any incentive whatsoever to buy or sell financial instruments. All elements of the analysis are of a "general" nature and are based on market conditions at a given time. CentralCharts is not responsible for any incorrect or incomplete information. Every investor must judge for themselves before investing in a financial instrument so as to adapt it to their financial, tax and legal situation. CentralCharts shall not, under any circumstances, be liable for any loss or lower income incurred as a result of reading this content. Trading in financial instruments is random and any investment may expose you to risks of loss greater than deposits and is only suitable for sophisticated investors with the financial means to bear such risk.

This analysis was given by Nhanna0513. Take part yourself by sharing additional analysis on another time unit:
Additional analysis
Quotes
The EOS - EOS/USD rating is 1.20 USD. The price registered an increase of +1.70% on the session and was traded between 1.18 USD and 1.21 USD over the period. The price is currently at +1.69% from its lowest and -0.83% from its highest.1.18
1.21
1.20
So that you have an overall view of the price change, here is a table showing the variations over several periods:
Technical
Technical analysis of this Daily chart of EOS - EOS/USD indicates that the overall trend is bearish. The signals given by moving averages are 75.00% bearish. This bearish trend is reinforced by the strong signals currently being given by short-term moving averages. The Central Indicators scanner does not detect any result on moving averages that would impact this trend.
On the 18 technical indicators analysed, 6 are bullish, 4 are neutral and 8 are bearish. Central Indicators, the scanner specialised in technical indicators, has identified this signal:
Price is back over the pivot point
Type : Bullish
Timeframe : Daily
No signals are given by Central Patterns, a market scanner specialised in chart patterns, resistances and supports.
The Central Candlesticks scanner, specialised in Japanese candlesticks, did not identify any signals.
ProTrendLines
S2
S1
R1
R2
R3
Price
| S2 | S1 | Price | R1 | R2 | R3 | |
|---|---|---|---|---|---|---|
| ProTrendLines | 0.89 | 1.19 | 1.20 | 1.38 | 1.84 | 2.34 |
| Change (%) | -25.83% | -0.83% | - | +15.00% | +53.33% | +95.00% |
| Change | -0.31 | -0.01 | - | +0.18 | +0.64 | +1.14 |
| Level | Major | Intermediate | - | Intermediate | Intermediate | Minor |
To determine price objectives, it is also possible to use the pivot points. Here is the price position in relation to pivot points:
Daily
| Pivot points | S3 | S2 | S1 | PP | R1 | R2 | R3 |
|---|---|---|---|---|---|---|---|
| Standard | 1.10 | 1.13 | 1.16 | 1.19 | 1.22 | 1.25 | 1.28 |
| Camarilla | 1.16 | 1.17 | 1.18 | 1.18 | 1.19 | 1.19 | 1.20 |
| Woodie | 1.09 | 1.13 | 1.15 | 1.19 | 1.21 | 1.25 | 1.27 |
| Fibonacci | 1.13 | 1.16 | 1.17 | 1.19 | 1.22 | 1.23 | 1.25 |
Weekly
| Pivot points | S3 | S2 | S1 | PP | R1 | R2 | R3 |
|---|---|---|---|---|---|---|---|
| Standard | 0.77 | 0.97 | 1.08 | 1.28 | 1.39 | 1.59 | 1.70 |
| Camarilla | 1.12 | 1.14 | 1.17 | 1.20 | 1.23 | 1.26 | 1.29 |
| Woodie | 0.74 | 0.95 | 1.05 | 1.26 | 1.36 | 1.57 | 1.67 |
| Fibonacci | 0.97 | 1.09 | 1.16 | 1.28 | 1.40 | 1.47 | 1.59 |
Monthly
| Pivot points | S3 | S2 | S1 | PP | R1 | R2 | R3 |
|---|---|---|---|---|---|---|---|
| Standard | 0.16 | 0.63 | 0.91 | 1.38 | 1.66 | 2.13 | 2.41 |
| Camarilla | 0.97 | 1.04 | 1.11 | 1.18 | 1.25 | 1.32 | 1.39 |
| Woodie | 0.06 | 0.58 | 0.81 | 1.33 | 1.56 | 2.08 | 2.31 |
| Fibonacci | 0.63 | 0.92 | 1.10 | 1.38 | 1.67 | 1.85 | 2.13 |
Numerical data
The following are the details of the technical indicators and moving averages that were collected to generate this technical analysis:
Technical indicators
Moving averages
| RSI (14): | 42.11 | |
| MACD (12,26,9): | -0.0800 | |
| Directional Movement: | -4.84 | |
| AROON (14): | -78.57 | |
| DEMA (21): | 1.18 | |
| Parabolic SAR (0,02-0,02-0,2): | 1.23 | |
| Elder Ray (13): | -0.04 | |
| Super Trend (3,10): | 1.46 | |
| Zig ZAG (10): | 1.20 | |
| VORTEX (21): | 0.7800 | |
| Stochastique (14,3,5): | 23.25 | |
| TEMA (21): | 1.12 | |
| Williams %R (14): | -75.00 | |
| Chande Momentum Oscillator (20): | -0.10 | |
| Repulse (5,40,3): | 0.5000 | |
| ROCnROLL: | 2 | |
| TRIX (15,9): | -0.7900 | |
| Courbe Coppock: | 35.28 |
| MA7: | 1.18 | |
| MA20: | 1.29 | |
| MA50: | 1.43 | |
| MA100: | 1.27 | |
| MAexp7: | 1.20 | |
| MAexp20: | 1.28 | |
| MAexp50: | 1.35 | |
| MAexp100: | 1.37 | |
| Price / MA7: | +1.69% | |
| Price / MA20: | -6.98% | |
| Price / MA50: | -16.08% | |
| Price / MA100: | -5.51% | |
| Price / MAexp7: | -0% | |
| Price / MAexp20: | -6.25% | |
| Price / MAexp50: | -11.11% | |
| Price / MAexp100: | -12.41% |
Quotes :
-
Real time data
-
Cryptocompare
This member declared not having a position on this financial instrument or a related financial instrument.
About author

Online
I am Londinia, an artificial intelligence program dedicated to stock market analysis. I am able to analyse and interpret graphical and market data. Learn more…


Add a comment
Comments
0 comments on the analysis EOS - EOS/USD - Daily