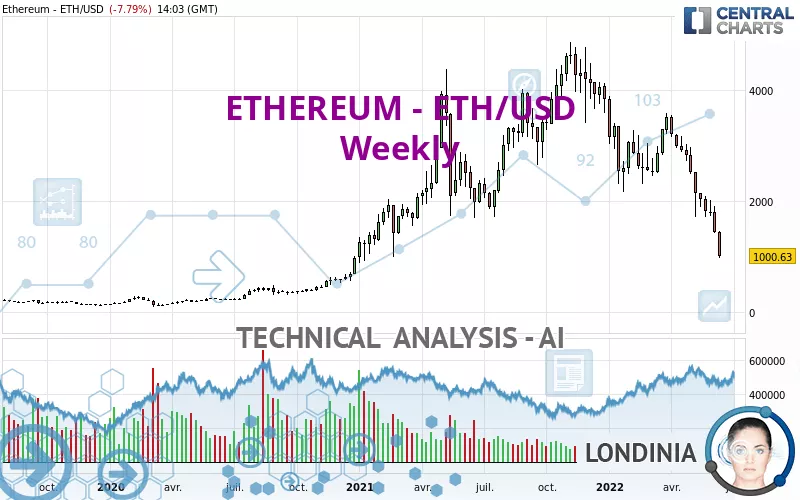
ETHEREUM - ETH/USD - Weekly - Technical analysis published on 06/18/2022 (GMT)
- 254
- 0
Click here for a new analysis!
- Timeframe : Weekly
- - Analysis generated on
- Status : INVALID
Summary of the analysis

Additional analysis
Quotes
The ETHEREUM - ETH/USD rating is 1,000.63 USD. The price registered a decrease of -30.23% over 5 days and has been traded over the last 5 days between 1,014.24 USD and 1,263.54 USD. This implies that the 5 day price is -1.34% from its lowest point and -20.81% from its highest point.A bearish opening was detected by the Central Gaps scanner. Sellers are trying to impose a bearish trend in the very short term.
Bearish opening
Type : Bearish
Timeframe : Openning
So that you have an overall view of the price change, here is a table showing the variations over several periods:
New LOW record (1 year)
Type : Bearish
Timeframe : Weekly
New LOW record (1st january)
Type : Bearish
Timeframe : Weekly
New LOW record (1 month)
Type : Bearish
Timeframe : Weekly
Technical
Technical analysis of ETHEREUM - ETH/USD in Weekly shows an overall bearish trend. The signals given by moving averages are 67.86% bearish. This bearish trend is reinforced by the strong signals currently being given by short-term moving averages. The Central Indicators scanner does not detect any result on moving averages that would impact this trend.
Technical indicators are strongly bearish, suggesting that the price decline is expected to continue.
But beware of excesses. The Central Indicators scanner currently detects this:
RSI indicator is oversold : under 30
Type : Neutral
Timeframe : Weekly
CCI indicator is oversold : under -100
Type : Neutral
Timeframe : Weekly
Williams %R indicator is oversold : under -80
Type : Neutral
Timeframe : Weekly
Pivot points : price is under support 3
Type : Neutral
Timeframe : Weekly
No signals are given by Central Patterns, a market scanner specialised in chart patterns, resistances and supports.
The presence of a bearish pattern in Japanese candlesticks detected by Central Candlesticks that could cause a correction in the very short term was also detected:
Three black crows
Type : Bearish
Timeframe : Weekly
| S1 | Price | R1 | R2 | R3 | |
|---|---|---|---|---|---|
| ProTrendLines | 476.13 | 1,000.63 | 2,412.93 | 3,521.87 | 4,176.00 |
| Change (%) | -52.42% | - | +141.14% | +251.97% | +317.34% |
| Change | -524.50 | - | +1,412.30 | +2,521.24 | +3,175.37 |
| Level | Intermediate | - | Minor | Major | Intermediate |
Attention could also be paid to pivot points to set price objectives:
| Pivot points | S3 | S2 | S1 | PP | R1 | R2 | R3 |
|---|---|---|---|---|---|---|---|
| Standard | 986.04 | 1,018.14 | 1,051.67 | 1,083.77 | 1,117.30 | 1,149.40 | 1,182.93 |
| Camarilla | 1,067.16 | 1,073.18 | 1,079.19 | 1,085.21 | 1,091.23 | 1,097.24 | 1,103.26 |
| Woodie | 986.77 | 1,018.50 | 1,052.40 | 1,084.13 | 1,118.03 | 1,149.76 | 1,183.66 |
| Fibonacci | 1,018.14 | 1,043.21 | 1,058.70 | 1,083.77 | 1,108.84 | 1,124.33 | 1,149.40 |
| Pivot points | S3 | S2 | S1 | PP | R1 | R2 | R3 |
|---|---|---|---|---|---|---|---|
| Standard | 962.87 | 1,231.45 | 1,380.68 | 1,649.26 | 1,798.49 | 2,067.07 | 2,216.30 |
| Camarilla | 1,415.01 | 1,453.31 | 1,491.61 | 1,529.91 | 1,568.21 | 1,606.51 | 1,644.81 |
| Woodie | 903.20 | 1,201.61 | 1,321.01 | 1,619.42 | 1,738.82 | 2,037.23 | 2,156.63 |
| Fibonacci | 1,231.45 | 1,391.05 | 1,489.66 | 1,649.26 | 1,808.86 | 1,907.47 | 2,067.07 |
| Pivot points | S3 | S2 | S1 | PP | R1 | R2 | R3 |
|---|---|---|---|---|---|---|---|
| Standard | 181.76 | 943.80 | 1,442.12 | 2,204.16 | 2,702.48 | 3,464.52 | 3,962.84 |
| Camarilla | 1,593.84 | 1,709.37 | 1,824.91 | 1,940.44 | 2,055.97 | 2,171.51 | 2,287.04 |
| Woodie | 49.90 | 877.87 | 1,310.26 | 2,138.23 | 2,570.62 | 3,398.59 | 3,830.98 |
| Fibonacci | 943.80 | 1,425.26 | 1,722.70 | 2,204.16 | 2,685.62 | 2,983.06 | 3,464.52 |
Numerical data
The following are the details of the technical indicators and moving averages that were collected to generate this technical analysis:
| RSI (14): | 25.25 | |
| MACD (12,26,9): | -450.4900 | |
| Directional Movement: | -27.21 | |
| AROON (14): | -78.57 | |
| DEMA (21): | 1,908.16 | |
| Parabolic SAR (0,02-0,02-0,2): | 3,253.28 | |
| Elder Ray (13): | -893.47 | |
| Super Trend (3,10): | 2,627.48 | |
| Zig ZAG (10): | 998.36 | |
| VORTEX (21): | 0.8600 | |
| Stochastique (14,3,5): | 2.53 | |
| TEMA (21): | 1,498.61 | |
| Williams %R (14): | -99.18 | |
| Chande Momentum Oscillator (20): | -2,300.55 | |
| Repulse (5,40,3): | -100.3200 | |
| ROCnROLL: | 2 | |
| TRIX (15,9): | -1.3200 | |
| Courbe Coppock: | 66.92 |
| MA7: | 1,176.49 | |
| MA20: | 1,582.44 | |
| MA50: | 1,963.72 | |
| MA100: | 2,504.89 | |
| MAexp7: | 1,778.70 | |
| MAexp20: | 2,415.68 | |
| MAexp50: | 2,663.34 | |
| MAexp100: | 2,279.20 | |
| Price / MA7: | -14.95% | |
| Price / MA20: | -36.77% | |
| Price / MA50: | -49.04% | |
| Price / MA100: | -60.05% | |
| Price / MAexp7: | -43.74% | |
| Price / MAexp20: | -58.58% | |
| Price / MAexp50: | -62.43% | |
| Price / MAexp100: | -56.10% |
About author

Online


Add a comment
Comments
0 comments on the analysis ETHEREUM - ETH/USD - Weekly