| Open: | 2.16 |
| Change: | +0.16 |
| Volume: | 114,750 |
| Low: | 2.16 |
| High: | 2.28 |
| High / Low range: | 0.12 |
| Type: | Cryptocurrencies |
| Ticker: | BCHUSD |
| ISIN: |
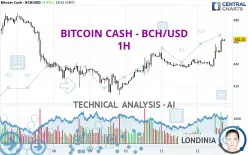
BITCOIN CASH - BCH/USD - 1H - Technical analysis published on 01/12/2025 (GMT)
- 128
- 0
- 01/12/2025 - 18:15
Click here for a new analysis!
- Timeframe : 1H
- - Analysis generated on 01/12/2025 - 18:15
- Status : INVALID

Summary of the analysis

Additional analysis
Quotes
The BITCOIN CASH - BCH/USD rating is 462.15 USD. The price has increased by +4.83% since the last closing and was traded between 436.51 USD and 463.59 USD over the period. The price is currently at +5.87% from its lowest and -0.31% from its highest.The Central Gaps scanner detects a bullish opening. A small advantage for buyers in the very short term.
Bullish opening
Type : Bullish
Timeframe : Openning
A study of price movements over other periods shows the following variations:
Technical
Technical analysis of BITCOIN CASH - BCH/USD in 1H shows a strongly overall bullish trend. 92.86% of the signals given by moving averages are bullish. The overall trend is supported by the strong bullish signals from short-term moving averages. The Central Indicators scanner does not detect any result on moving averages that would impact this trend.
Technical indicators are strongly bullish, suggesting that the price increase should continue.
Caution: the Central Indicators scanner currently detects an excess:
RSI indicator is overbought : over 70
Type : Neutral
Timeframe : 1 hour
CCI indicator is overbought : over 100
Type : Neutral
Timeframe : 1 hour
Williams %R indicator is overbought : over -20
Type : Neutral
Timeframe : 1 hour
Pivot points : price is over resistance 2
Type : Neutral
Timeframe : 1 hour
Price is back over the pivot point
Type : Bullish
Timeframe : Weekly
Price is back under the pivot point
Type : Bearish
Timeframe : Weekly
No signals are given by Central Patterns, a market scanner specialised in chart patterns, resistances and supports.
The Central Candlesticks scanner, specialised in Japanese candlesticks, did not identify any signals.
| S3 | S2 | S1 | Price | R1 | R2 | R3 | |
|---|---|---|---|---|---|---|---|
| ProTrendLines | 431.55 | 438.97 | 455.72 | 462.15 | 462.69 | 472.15 | 486.16 |
| Change (%) | -6.62% | -5.02% | -1.39% | - | +0.12% | +2.16% | +5.20% |
| Change | -30.60 | -23.18 | -6.43 | - | +0.54 | +10.00 | +24.01 |
| Level | Intermediate | Major | Minor | - | Intermediate | Intermediate | Intermediate |
Pivot points can also be used to set your price objectives. Here is the price situation in relation to pivot points:
| Pivot points | S3 | S2 | S1 | PP | R1 | R2 | R3 |
|---|---|---|---|---|---|---|---|
| Standard | 419.06 | 427.45 | 434.15 | 442.54 | 449.24 | 457.63 | 464.33 |
| Camarilla | 436.71 | 438.09 | 439.48 | 440.86 | 442.24 | 443.63 | 445.01 |
| Woodie | 418.23 | 427.03 | 433.32 | 442.12 | 448.41 | 457.21 | 463.50 |
| Fibonacci | 427.45 | 433.21 | 436.77 | 442.54 | 448.30 | 451.86 | 457.63 |
| Pivot points | S3 | S2 | S1 | PP | R1 | R2 | R3 |
|---|---|---|---|---|---|---|---|
| Standard | 331.52 | 371.54 | 406.20 | 446.22 | 480.88 | 520.90 | 555.56 |
| Camarilla | 420.32 | 427.17 | 434.01 | 440.86 | 447.71 | 454.55 | 461.40 |
| Woodie | 328.84 | 370.20 | 403.52 | 444.88 | 478.20 | 519.56 | 552.88 |
| Fibonacci | 371.54 | 400.07 | 417.69 | 446.22 | 474.75 | 492.37 | 520.90 |
| Pivot points | S3 | S2 | S1 | PP | R1 | R2 | R3 |
|---|---|---|---|---|---|---|---|
| Standard | 85.41 | 237.57 | 335.62 | 487.78 | 585.83 | 737.99 | 836.04 |
| Camarilla | 364.87 | 387.81 | 410.74 | 433.68 | 456.62 | 479.55 | 502.49 |
| Woodie | 58.37 | 224.04 | 308.58 | 474.25 | 558.79 | 724.46 | 809.00 |
| Fibonacci | 237.57 | 333.15 | 392.20 | 487.78 | 583.36 | 642.41 | 737.99 |
Numerical data
The following is the status of the technical indicators and moving averages at the time of publication of this technical analysis:
| RSI (14): | 76.93 | |
| MACD (12,26,9): | 4.8500 | |
| Directional Movement: | 37.51 | |
| AROON (14): | 57.15 | |
| DEMA (21): | 454.02 | |
| Parabolic SAR (0,02-0,02-0,2): | 443.06 | |
| Elder Ray (13): | 9.39 | |
| Super Trend (3,10): | 448.60 | |
| Zig ZAG (10): | 461.27 | |
| VORTEX (21): | 1.2300 | |
| Stochastique (14,3,5): | 92.50 | |
| TEMA (21): | 457.65 | |
| Williams %R (14): | -6.94 | |
| Chande Momentum Oscillator (20): | 20.89 | |
| Repulse (5,40,3): | 1.3900 | |
| ROCnROLL: | 1 | |
| TRIX (15,9): | 0.0900 | |
| Courbe Coppock: | 6.22 |
| MA7: | 446.96 | |
| MA20: | 452.03 | |
| MA50: | 497.47 | |
| MA100: | 439.26 | |
| MAexp7: | 455.74 | |
| MAexp20: | 448.56 | |
| MAexp50: | 443.57 | |
| MAexp100: | 442.83 | |
| Price / MA7: | +3.40% | |
| Price / MA20: | +2.24% | |
| Price / MA50: | -7.10% | |
| Price / MA100: | +5.21% | |
| Price / MAexp7: | +1.41% | |
| Price / MAexp20: | +3.03% | |
| Price / MAexp50: | +4.19% | |
| Price / MAexp100: | +4.36% |
About author
Online


Add a comment
Comments
0 comments on the analysis BITCOIN CASH - BCH/USD - 1H