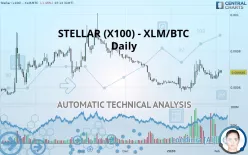
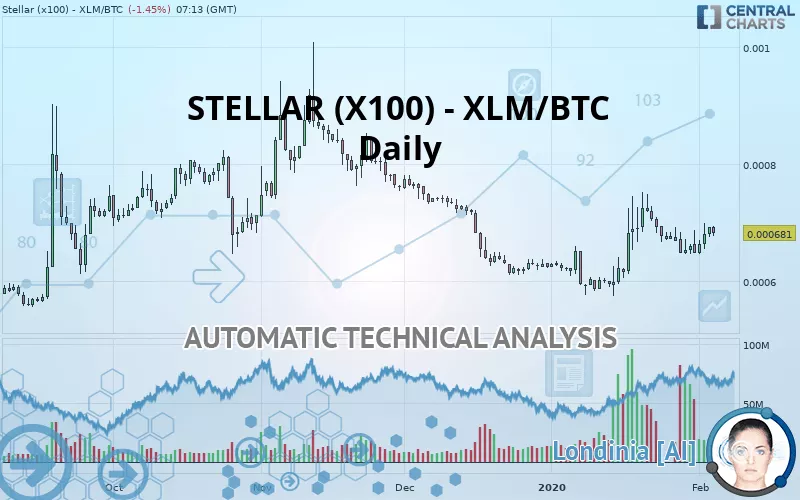
STELLAR (X100) - XLM/BTC - Daily - Technical analysis published on 02/04/2020 (GMT)
- 330
- 0
- Who voted?
Click here for a new analysis!
- Timeframe : Daily
- - Analysis generated on
- Status : TARGET REACHED
Summary of the analysis

Additional analysis
Quotes
The STELLAR (X100) - XLM/BTC price is 0.000681 BTC. The price registered an increase of -1.45% on the session and was traded between 0.000677 BTC and 0.000694 BTC over the period. The price is currently at +0.59% from its lowest and -1.87% from its highest.Here is a more detailed summary of the historical variations registered by STELLAR (X100) - XLM/BTC:
Abnormal volumes
Timeframe : 20 days
Technical
Technical analysis of STELLAR (X100) - XLM/BTC in Daily shows an overall slightly bearish trend. 53.57% of the signals given by moving averages are bearish. Caution: the strong bullish signals currently being given by short-term moving averages could quickly lead to a reversal of the trend. An assessment of moving averages reveals a bullish signal that could impact this trend:
Bullish price crossover with adaptative moving average 100
Type : Bullish
Timeframe : Daily
On the 18 technical indicators analysed, 7 are bullish, 6 are neutral and 5 are bearish. Caution: the Central Indicators scanner currently detects an excess:
Williams %R indicator is overbought : over -20
Type : Neutral
Timeframe : Daily
Pivot points : price is under support 1
Type : Neutral
Timeframe : Daily
MACD crosses UP its Moving Average
Type : Bullish
Timeframe : Daily
Price is back over the pivot point
Type : Bullish
Timeframe : Daily
Price is back under the pivot point
Type : Bearish
Timeframe : Weekly
An analysis of the price chart with the Central Patterns scanner (detector of chart patterns and resistances and supports) shows a result that can have an impact on the price change:
Horizontal resistance is broken
Type : Bullish
Timeframe : Daily
The Central Candlesticks scanner, specialised in Japanese candlesticks, did not identify any signals.
| S3 | S2 | S1 | Price | R1 | R2 | R3 | |
|---|---|---|---|---|---|---|---|
| ProTrendLines | 0.000587 | 0.000629 | 0.000678 | 0.000681 | 0.000724 | 0.000759 | 0.000816 |
| Change (%) | -13.80% | -7.64% | -0.44% | - | +6.31% | +11.45% | +19.82% |
| Change | -0.000094 | -0.000052 | -0.000003 | - | +0.000043 | +0.000078 | +0.000135 |
| Level | Intermediate | Minor | Major | - | Intermediate | Minor | Intermediate |
Pivot points can also be used to set your price objectives. Here is the price situation in relation to pivot points:
| Pivot points | S3 | S2 | S1 | PP | R1 | R2 | R3 |
|---|---|---|---|---|---|---|---|
| Standard | 0.000663 | 0.000669 | 0.000680 | 0.000686 | 0.000697 | 0.000703 | 0.000714 |
| Camarilla | 0.000686 | 0.000688 | 0.000689 | 0.000691 | 0.000693 | 0.000694 | 0.000696 |
| Woodie | 0.000666 | 0.000670 | 0.000683 | 0.000687 | 0.000700 | 0.000704 | 0.000717 |
| Fibonacci | 0.000669 | 0.000676 | 0.000680 | 0.000686 | 0.000693 | 0.000697 | 0.000703 |
| Pivot points | S3 | S2 | S1 | PP | R1 | R2 | R3 |
|---|---|---|---|---|---|---|---|
| Standard | 0.000597 | 0.000621 | 0.000642 | 0.000666 | 0.000687 | 0.000711 | 0.000732 |
| Camarilla | 0.000650 | 0.000654 | 0.000658 | 0.000662 | 0.000666 | 0.000670 | 0.000674 |
| Woodie | 0.000595 | 0.000620 | 0.000640 | 0.000665 | 0.000685 | 0.000710 | 0.000730 |
| Fibonacci | 0.000621 | 0.000639 | 0.000649 | 0.000666 | 0.000684 | 0.000694 | 0.000711 |
| Pivot points | S3 | S2 | S1 | PP | R1 | R2 | R3 |
|---|---|---|---|---|---|---|---|
| Standard | 0.000385 | 0.000479 | 0.000563 | 0.000657 | 0.000741 | 0.000835 | 0.000919 |
| Camarilla | 0.000598 | 0.000614 | 0.000631 | 0.000647 | 0.000663 | 0.000680 | 0.000696 |
| Woodie | 0.000380 | 0.000477 | 0.000558 | 0.000655 | 0.000736 | 0.000833 | 0.000914 |
| Fibonacci | 0.000479 | 0.000547 | 0.000589 | 0.000657 | 0.000725 | 0.000767 | 0.000835 |
Numerical data
The following is the status of technical indicators and moving averages registered at the time this technical analysis was created:
| RSI (14): | 54.31 | |
| MACD (12,26,9): | 0.0000 | |
| Directional Movement: | 14.637282 | |
| AROON (14): | -78.571426 | |
| DEMA (21): | 0.000675 | |
| Parabolic SAR (0,02-0,02-0,2): | 0.000727 | |
| Elder Ray (13): | 0.000016 | |
| Super Trend (3,10): | 0.000606 | |
| Zig ZAG (10): | 0.000680 | |
| VORTEX (21): | 1.1342 | |
| Stochastique (14,3,5): | 39.49 | |
| TEMA (21): | 0.000683 | |
| Williams %R (14): | -58.02 | |
| Chande Momentum Oscillator (20): | -0.000012 | |
| Repulse (5,40,3): | -0.0911 | |
| ROCnROLL: | 1 | |
| TRIX (15,9): | 0.1842 | |
| Courbe Coppock: | 4.04 |
| MA7: | 0.000668 | |
| MA20: | 0.000677 | |
| MA50: | 0.000643 | |
| MA100: | 0.000713 | |
| MAexp7: | 0.000674 | |
| MAexp20: | 0.000666 | |
| MAexp50: | 0.000668 | |
| MAexp100: | 0.000696 | |
| Price / MA7: | +1.95% | |
| Price / MA20: | +0.59% | |
| Price / MA50: | +5.91% | |
| Price / MA100: | -4.49% | |
| Price / MAexp7: | +1.04% | |
| Price / MAexp20: | +2.25% | |
| Price / MAexp50: | +1.95% | |
| Price / MAexp100: | -2.16% |
About author

Online


Add a comment
Comments
0 comments on the analysis STELLAR (X100) - XLM/BTC - Daily