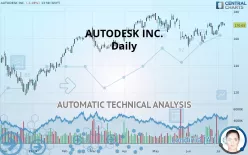
AUTODESK INC. - Daily - Technical analysis published on 07/08/2019 (GMT)
- 436
- 0
- Who voted?
Click here for a new analysis!
- Timeframe : Daily
- - Analysis generated on
- Status : INVALID

Summary of the analysis

Additional analysis
Quotes
The AUTODESK INC. price is 170.03 USD. On the day, this instrument lost -1.28% with the lowest point at 169.45 USD and the highest point at 171.39 USD. The deviation from the price is +0.34% for the low point and -0.79% for the high point.The Central Gaps scanner detects a bullish opening marking the presence of sellers ahead of buyers at the opening but not sufficiently marked to allow the price to register a quotation gap.
Bearish opening
Type : Bearish
Timeframe : Openning
So that you have an overall view of the price change, here is a table showing the variations over several periods:
Near a new HIGH record (5 years)
Type : Bullish
Timeframe : Weekly
Near a new HIGH record (1 year)
Type : Bullish
Timeframe : Weekly
Near a new HIGH record (1st january)
Type : Bullish
Timeframe : Weekly
Near a new HIGH record (1 month)
Type : Bullish
Timeframe : Weekly
Technical
Technical analysis of AUTODESK INC. in Daily shows a strongly overall bullish trend. 82.14% of the signals given by moving averages are bullish. This strongly bullish trend is supported by the strong bullish signals given by short-term moving averages. The Central Indicators scanner detects a bullish signal on moving averages that could impact this trend:
Moving Average bullish crossovers : AMA20 & AMA50
Type : Bullish
Timeframe : Daily
Technical indicators are strongly bullish, suggesting that the price increase should continue.
Caution: the Central Indicators scanner currently detects an excess:
CCI indicator is overbought : over 100
Type : Neutral
Timeframe : Daily
CCI indicator: bearish divergence
Type : Bearish
Timeframe : Daily
Williams %R indicator is overbought : over -20
Type : Neutral
Timeframe : Daily
Pivot points : price is over resistance 1
Type : Neutral
Timeframe : Weekly
Pivot points : price is under support 1
Type : Neutral
Timeframe : Daily
Price is back over the pivot point
Type : Bullish
Timeframe : Daily
An analysis of the price chart with the Central Patterns scanner (detector of chart patterns and resistances and supports) shows several results that can have an impact on the price change:
Near horizontal resistance
Type : Bearish
Timeframe : Daily
Resistance of channel is broken
Type : Bullish
Timeframe : Daily
No result was found by the Central Candlesticks scanner on Japanese candlesticks.
| S3 | S2 | S1 | Price | R1 | |
|---|---|---|---|---|---|
| ProTrendLines | 140.61 | 157.20 | 164.50 | 170.03 | 178.21 |
| Change (%) | -17.30% | -7.55% | -3.25% | - | +4.81% |
| Change | -29.42 | -12.83 | -5.53 | - | +8.18 |
| Level | Minor | Major | Intermediate | - | Major |
Attention could also be paid to pivot points to set price objectives:
| Pivot points | S3 | S2 | S1 | PP | R1 | R2 | R3 |
|---|---|---|---|---|---|---|---|
| Standard | 166.49 | 167.67 | 170.33 | 171.34 | 173.23 | 174.24 | 176.13 |
| Camarilla | 171.08 | 171.39 | 171.69 | 172.00 | 172.31 | 172.61 | 172.92 |
| Woodie | 166.99 | 167.92 | 170.33 | 171.26 | 173.67 | 174.59 | 177.01 |
| Fibonacci | 168.44 | 169.54 | 170.23 | 171.34 | 172.44 | 173.07 | 174.35 |
| Pivot points | S3 | S2 | S1 | PP | R1 | R2 | R3 |
|---|---|---|---|---|---|---|---|
| Standard | 150.03 | 156.17 | 167.72 | 170.03 | 174.54 | 176.85 | 181.36 |
| Camarilla | 160.28 | 161.16 | 162.03 | 162.90 | 163.77 | 164.64 | 165.52 |
| Woodie | 148.63 | 155.48 | 158.15 | 164.99 | 167.65 | 174.50 | 177.16 |
| Fibonacci | 163.21 | 165.82 | 167.42 | 170.03 | 172.64 | 171.56 | 175.19 |
Numerical data
The following is the status of technical indicators and moving averages registered at the time this technical analysis was created:
| RSI (14): | 55.96 | |
| MACD (12,26,9): | 1.3500 | |
| Directional Movement: | 6.12 | |
| AROON (14): | 92.86 | |
| DEMA (21): | 168.21 | |
| Parabolic SAR (0,02-0,02-0,2): | 162.66 | |
| Elder Ray (13): | 2.69 | |
| Super Trend (3,10): | 158.87 | |
| Zig ZAG (10): | 170.17 | |
| VORTEX (21): | 1.0300 | |
| Stochastique (14,3,5): | 92.01 | |
| TEMA (21): | 169.81 | |
| Williams %R (14): | -20.35 | |
| Chande Momentum Oscillator (20): | 4.00 | |
| Repulse (5,40,3): | 1.0400 | |
| ROCnROLL: | 1 | |
| TRIX (15,9): | 0.0200 | |
| Courbe Coppock: | 8.20 |
| MA7: | 168.90 | |
| MA20: | 165.74 | |
| MA50: | 167.82 | |
| MA100: | 164.72 | |
| MAexp7: | 169.39 | |
| MAexp20: | 167.09 | |
| MAexp50: | 166.02 | |
| MAexp100: | 162.32 | |
| Price / MA7: | +0.67% | |
| Price / MA20: | +2.59% | |
| Price / MA50: | +1.32% | |
| Price / MA100: | +3.22% | |
| Price / MAexp7: | +0.38% | |
| Price / MAexp20: | +1.76% | |
| Price / MAexp50: | +2.42% | |
| Price / MAexp100: | +4.75% |
News
The latest news and videos published on AUTODESK INC. at the time of the analysis were as follows:
- Autodesk Introduces PlanGrid Advanced RFIs and Project Hub to Boost Project Visibility and Extend Workflows to the Field
- Autodesk to Present at the Berenberg Design Software Conference
- DLT Awarded 10-Year Department of Defense ESI Blanket Purchase Agreement for Autodesk Software
- Autodesk to Webcast Its Annual Meeting of Stockholders
- Autodesk to Present at Bank of America Merrill Lynch Global Technology Conference
About author

Online


Add a comment
Comments
0 comments on the analysis AUTODESK INC. - Daily