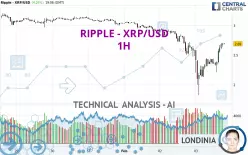
RIPPLE - XRP/USD - 1H - Technical analysis published on 02/03/2025 (GMT)
- 392
- 0
Click here for a new analysis!
- Timeframe : 1H
- - Analysis generated on
- Status : INVALID

Summary of the analysis

Additional analysis
Quotes
The RIPPLE - XRP/USD rating is 2.69 USD. The price registered an increase of +4.26% on the session and was between 1.82 USD and 2.70 USD. This implies that the price is at +47.80% from its lowest and at -0.37% from its highest.The Central Gaps scanner detects a bearish opening. A small advantage for sellers in the very short term.
Bearish opening
Type : Bearish
Timeframe : Openning
So that you have an overall view of the price change, here is a table showing the variations over several periods:
New LOW record (1st january)
Type : Bearish
Timeframe : Weekly
New LOW record (1 month)
Type : Bearish
Timeframe : Weekly
The Central Volumes scanner detects abnormal volumes on the asset:
Abnormal volumes
Timeframe : 20 days
Abnormal volumes
Timeframe : 50 days
Technical
Technical analysis of RIPPLE - XRP/USD in 1H shows an overall slightly bearish trend. Only 57.14% of the signals given by moving averages are bearish. This slightly bearish trend could quickly be reversed due to the strong bullish signals currently being given by short-term moving averages. There is no crossing of moving average by the price or crossing of moving averages between themselves.
In fact, 14 technical indicators on 18 studied are currently bullish. But beware of excesses. The Central Indicators scanner currently detects this:
CCI indicator is overbought : over 100
Type : Neutral
Timeframe : 1 hour
Williams %R indicator is overbought : over -20
Type : Neutral
Timeframe : 1 hour
Price is back under the pivot point
Type : Bearish
Timeframe : 1 hour
No signals are given by Central Patterns, a market scanner specialised in chart patterns, resistances and supports.
For a small setback in the very short term, the Central Candlesticks scanner currently notes the presence of this bearish pattern in Japanese candlesticks:
Bearish harami
Type : Bearish
Timeframe : 1 hour
Bearish harami cross
Type : Bearish
Timeframe : 1 hour
| S3 | S2 | S1 | Price | R1 | R2 | R3 | |
|---|---|---|---|---|---|---|---|
| ProTrendLines | 1.84 | 2.06 | 2.66 | 2.69 | 2.78 | 2.88 | 2.97 |
| Change (%) | -31.60% | -23.42% | -1.12% | - | +3.35% | +7.06% | +10.41% |
| Change | -0.85 | -0.63 | -0.03 | - | +0.09 | +0.19 | +0.28 |
| Level | Intermediate | Intermediate | Intermediate | - | Major | Minor | Intermediate |
To determine price objectives, it is also possible to use the pivot points. Here is the price position in relation to pivot points:
| Pivot points | S3 | S2 | S1 | PP | R1 | R2 | R3 |
|---|---|---|---|---|---|---|---|
| Standard | 1.90 | 2.19 | 2.38 | 2.67 | 2.86 | 3.15 | 3.34 |
| Camarilla | 2.45 | 2.49 | 2.54 | 2.58 | 2.62 | 2.67 | 2.71 |
| Woodie | 1.86 | 2.17 | 2.34 | 2.65 | 2.82 | 3.13 | 3.30 |
| Fibonacci | 2.19 | 2.37 | 2.48 | 2.67 | 2.85 | 2.96 | 3.15 |
| Pivot points | S3 | S2 | S1 | PP | R1 | R2 | R3 |
|---|---|---|---|---|---|---|---|
| Standard | 2.07 | 2.37 | 2.62 | 2.92 | 3.17 | 3.47 | 3.72 |
| Camarilla | 2.73 | 2.78 | 2.83 | 2.88 | 2.93 | 2.98 | 3.03 |
| Woodie | 2.06 | 2.36 | 2.61 | 2.91 | 3.16 | 3.46 | 3.71 |
| Fibonacci | 2.37 | 2.58 | 2.71 | 2.92 | 3.13 | 3.26 | 3.47 |
| Pivot points | S3 | S2 | S1 | PP | R1 | R2 | R3 |
|---|---|---|---|---|---|---|---|
| Standard | 0.96 | 1.52 | 2.28 | 2.84 | 3.60 | 4.16 | 4.92 |
| Camarilla | 2.68 | 2.80 | 2.92 | 3.04 | 3.16 | 3.28 | 3.40 |
| Woodie | 1.06 | 1.57 | 2.38 | 2.89 | 3.70 | 4.21 | 5.02 |
| Fibonacci | 1.52 | 2.02 | 2.34 | 2.84 | 3.34 | 3.66 | 4.16 |
Numerical data
The following are the details of the technical indicators and moving averages that were collected to generate this technical analysis:
| RSI (14): | 58.94 | |
| MACD (12,26,9): | -0.0100 | |
| Directional Movement: | -0.15 | |
| AROON (14): | 92.86 | |
| DEMA (21): | 2.45 | |
| Parabolic SAR (0,02-0,02-0,2): | 2.04 | |
| Elder Ray (13): | 0.17 | |
| Super Trend (3,10): | 2.28 | |
| Zig ZAG (10): | 2.65 | |
| VORTEX (21): | 1.0200 | |
| Stochastique (14,3,5): | 92.63 | |
| TEMA (21): | 2.53 | |
| Williams %R (14): | -7.45 | |
| Chande Momentum Oscillator (20): | 0.33 | |
| Repulse (5,40,3): | 5.9900 | |
| ROCnROLL: | 1 | |
| TRIX (15,9): | -0.4200 | |
| Courbe Coppock: | 21.32 |
| MA7: | 2.92 | |
| MA20: | 3.06 | |
| MA50: | 2.62 | |
| MA100: | 2.00 | |
| MAexp7: | 2.56 | |
| MAexp20: | 2.49 | |
| MAexp50: | 2.61 | |
| MAexp100: | 2.77 | |
| Price / MA7: | -7.88% | |
| Price / MA20: | -12.09% | |
| Price / MA50: | +2.67% | |
| Price / MA100: | +34.50% | |
| Price / MAexp7: | +5.08% | |
| Price / MAexp20: | +8.03% | |
| Price / MAexp50: | +3.07% | |
| Price / MAexp100: | -2.89% |
About author

Online


Add a comment
Comments
0 comments on the analysis RIPPLE - XRP/USD - 1H